Big Data · AI · Web
Maritime traffic analysis from AIS data
A third-year project in three parts — Big Data, artificial intelligence and web development — built on AIS data (vessel positions) from the Gulf of Mexico.
The three parts
Each part is covered in seven steps, illustrated with figures from the project.
Big Data analysis
-
Data collection and cleaning
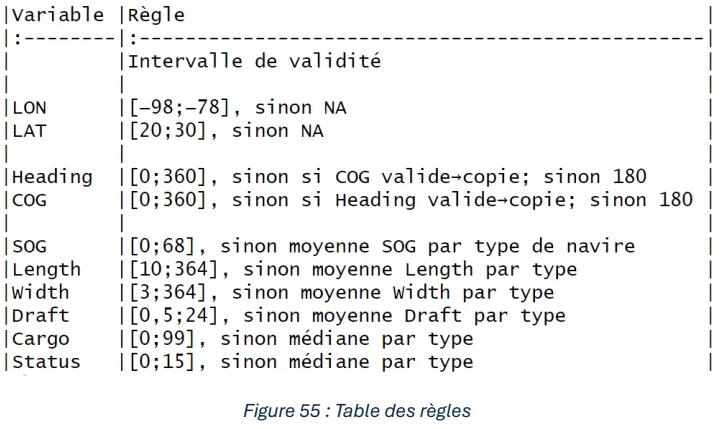
Acquisition of millions of AIS data points in the Gulf of Mexico. Handling of missing values and outliers, then removal of duplicates to guarantee the quality of the analysis.
-
Descriptive statistics
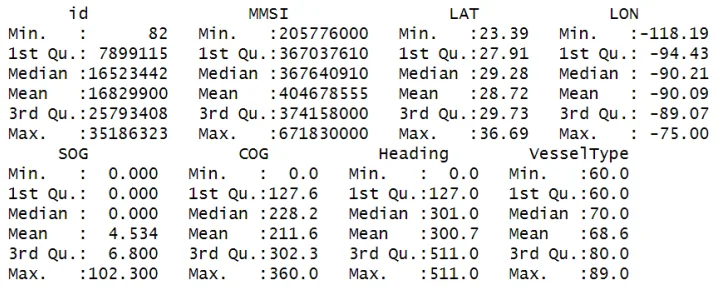
Univariate analysis of the variables: latitude, longitude, speed (SOG), course (COG). Identification of navigation patterns and high-density maritime areas.
-
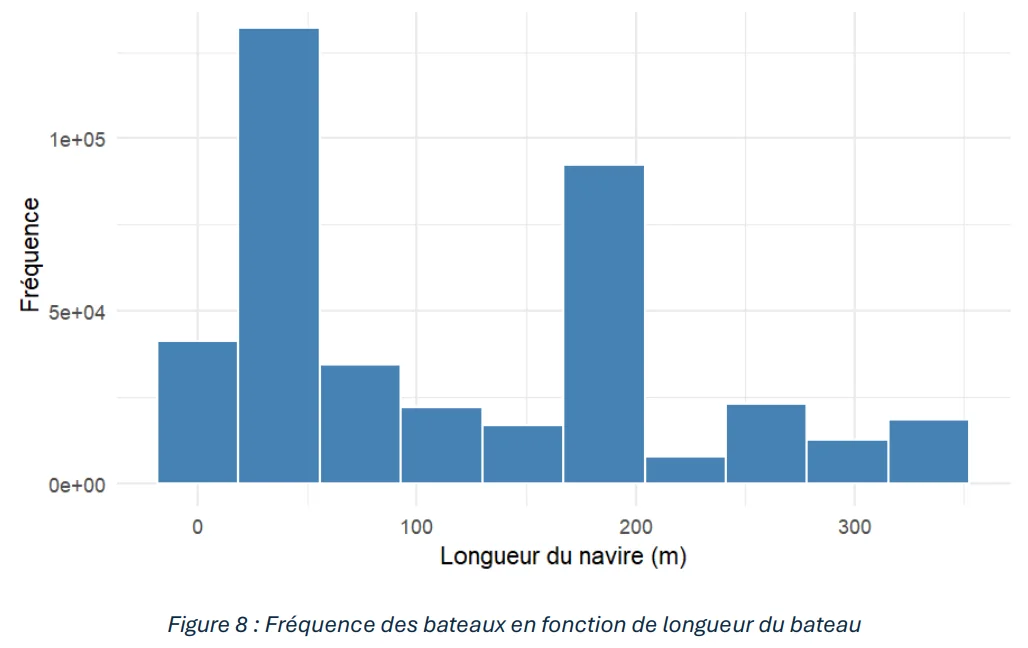
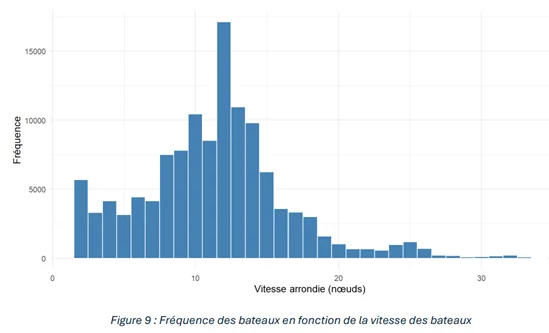
Visualisations
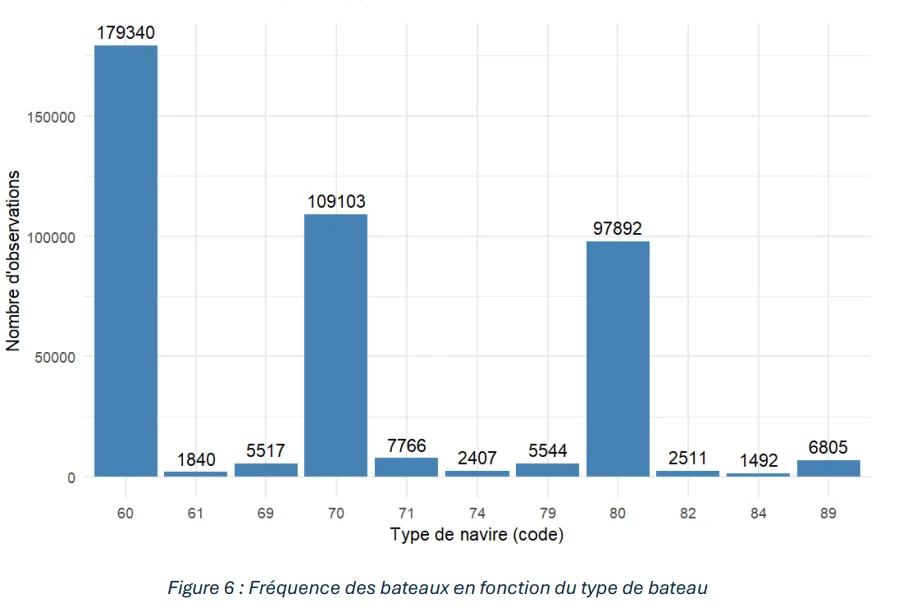
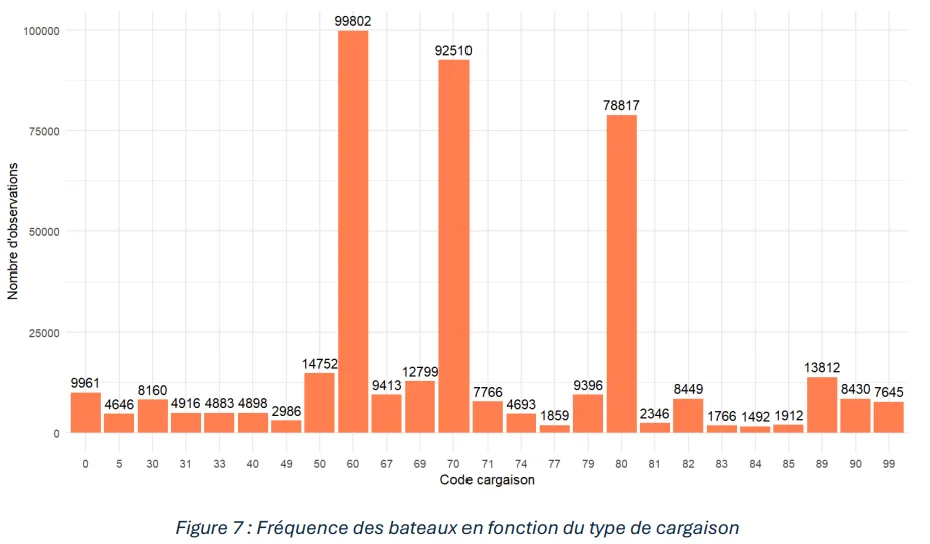
Charts to understand how vessels are distributed: by type (passenger, cargo, tanker), by speed and by length.
-
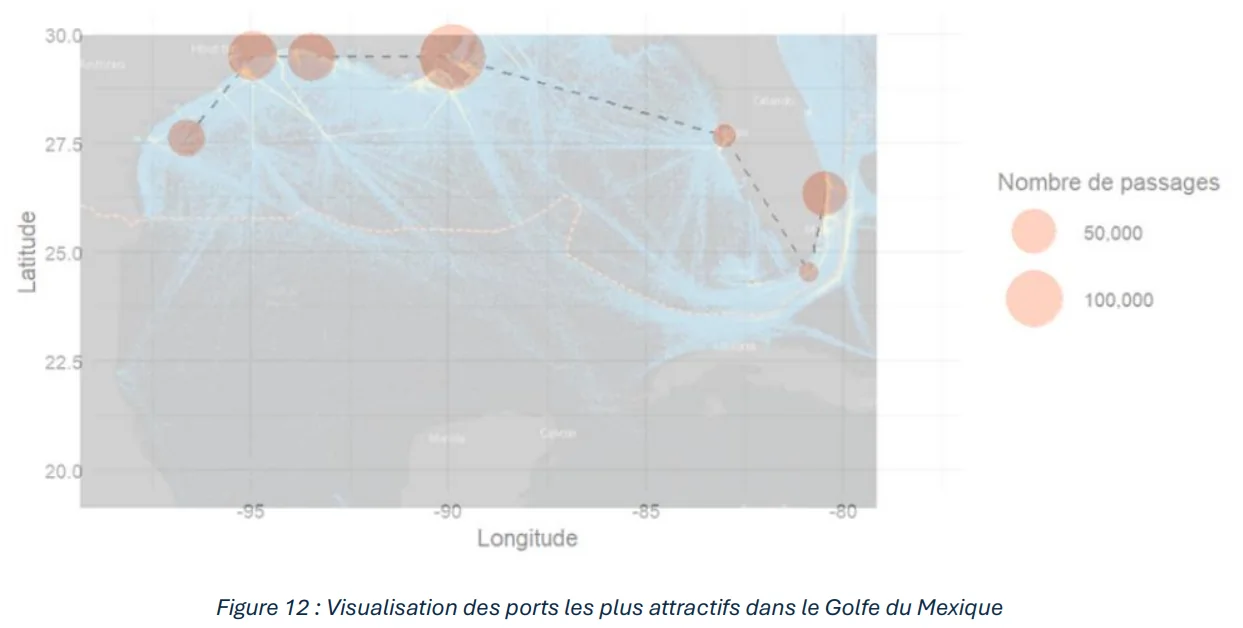
Finding the main ports
Automatic extraction of the most frequent position pairs to infer high-density points, then verification on a map of the Gulf of Mexico.
-
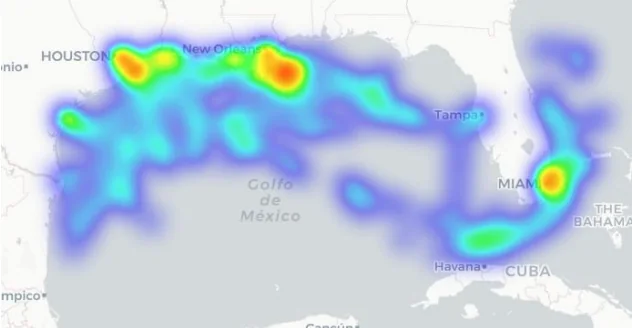
Heatmaps
Generation of heatmaps showing where maritime traffic is densest.
-
Correlation analysis
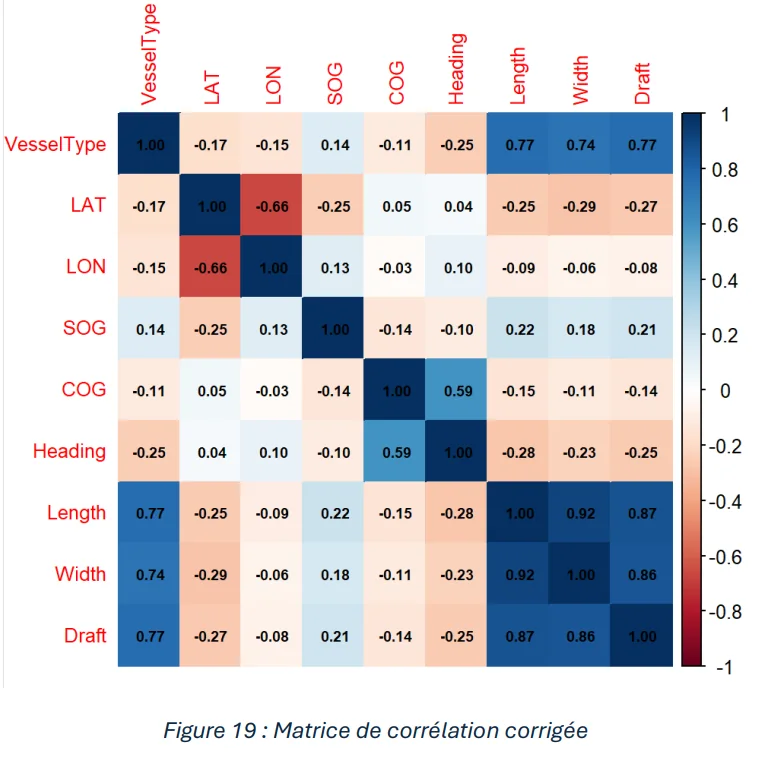
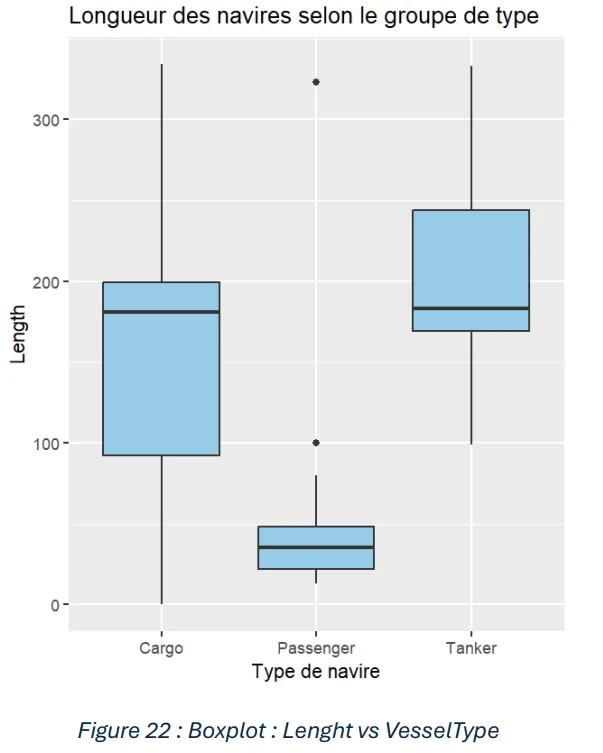
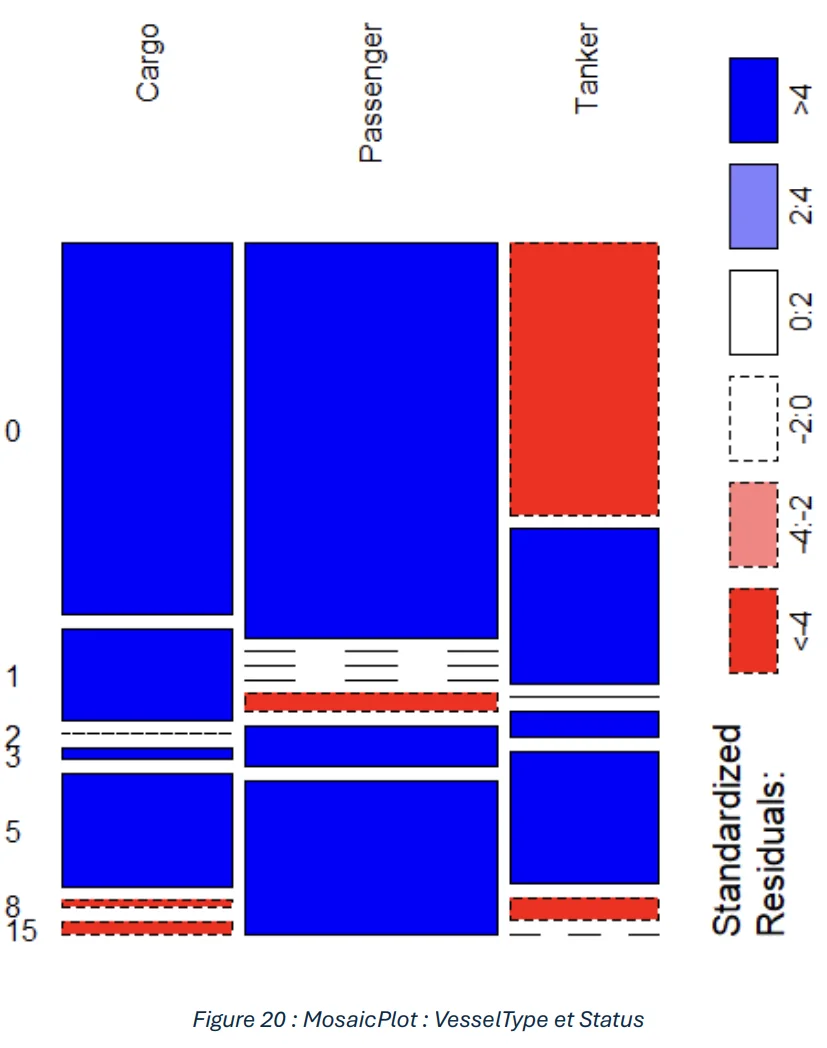
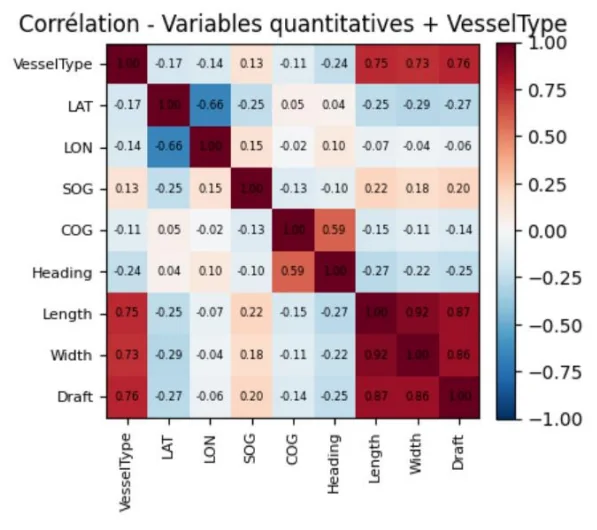
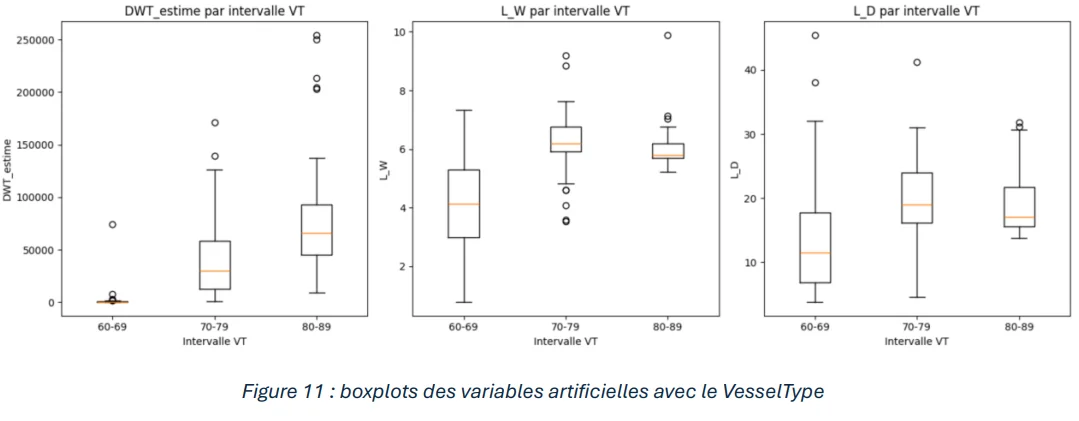
Study of the correlations between variables to prepare vessel type prediction: correlation matrix, statistical tests (Chi², ANOVA) and boxplots to validate the relationships.
-
Flow diagrams
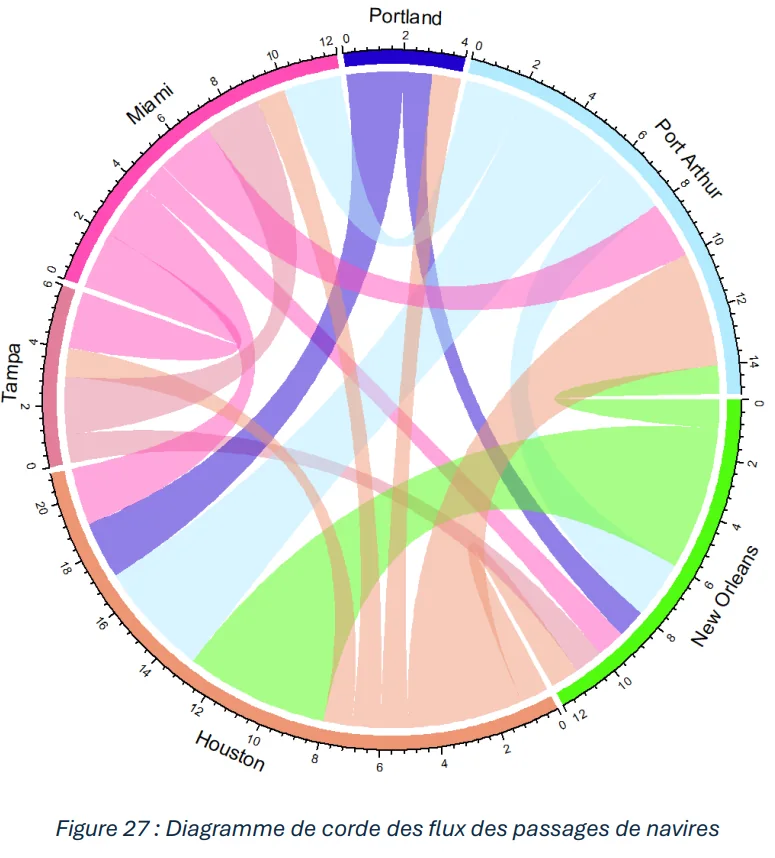
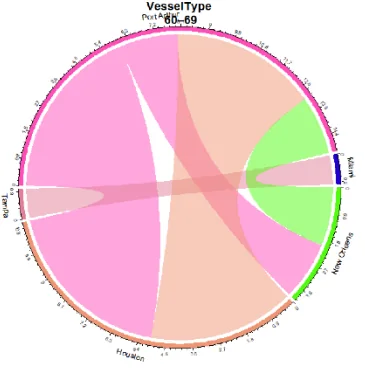
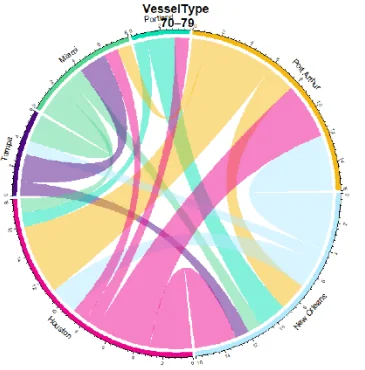
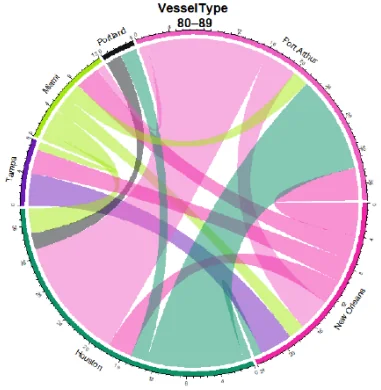
Chord diagrams visualise the flows between the major ports, then the exchanges by vessel type, to analyse the preferred routes.
Artificial intelligence
-
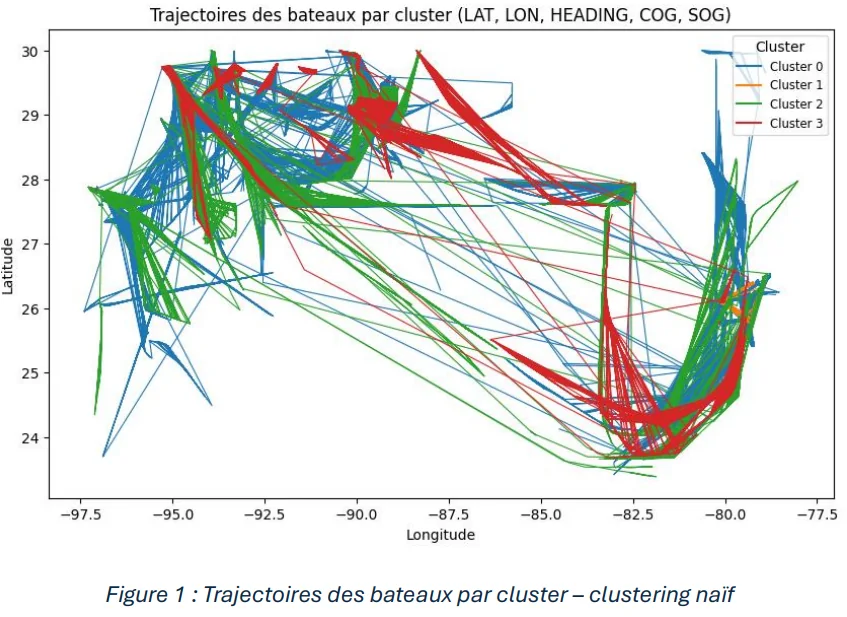
Trajectory clustering: first attempt
A first, naive approach: K-means applied directly to the navigation data (COG, SOG, latitude, longitude…).
-
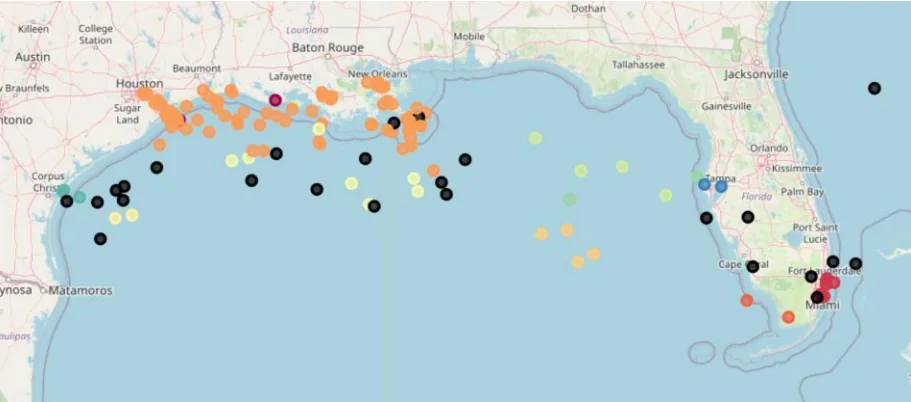
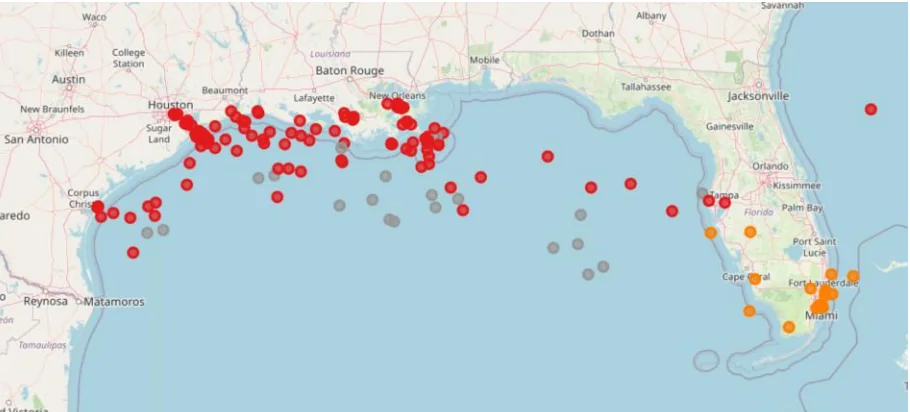
Comparing clustering methods
Several methods tried on the same navigation data, followed by DBSCAN and agglomerative hierarchical clustering (AHC).
-
Choosing the number of clusters
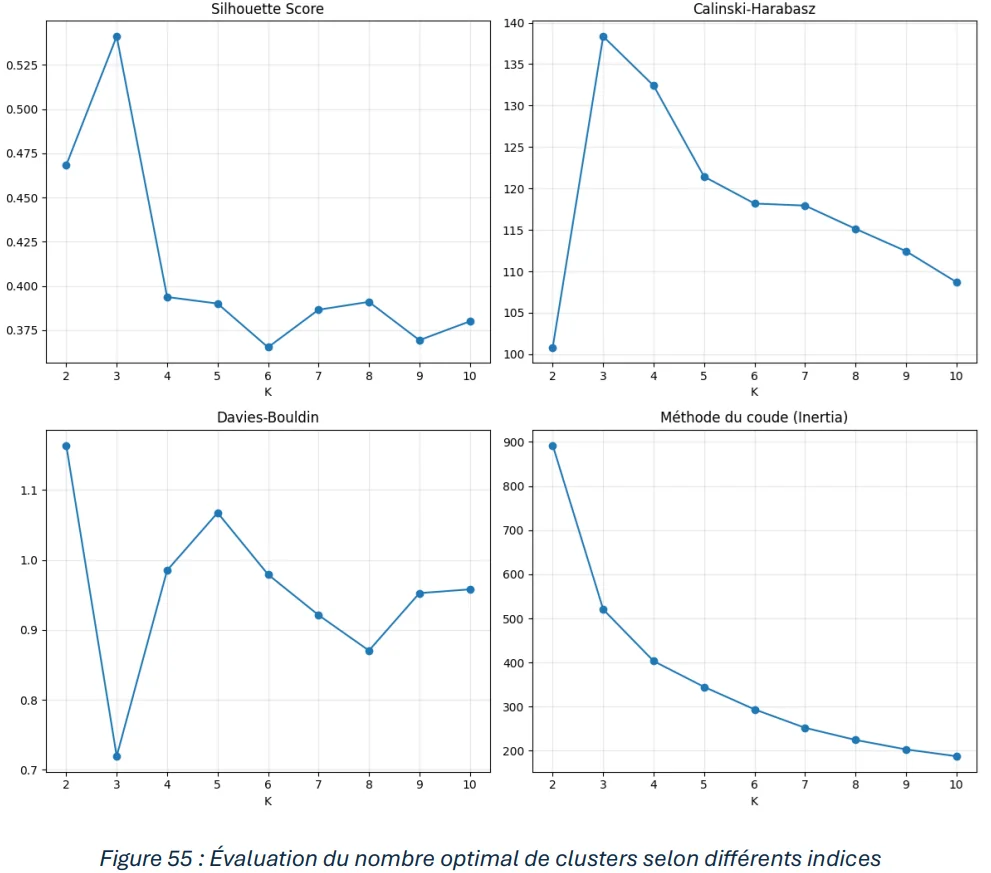
Evaluation of the optimal number of clusters with the silhouette score, the elbow method, the Davies-Bouldin index (to minimise) and the Calinski-Harabasz index (to maximise).
-
Feature engineering and cluster visualisation
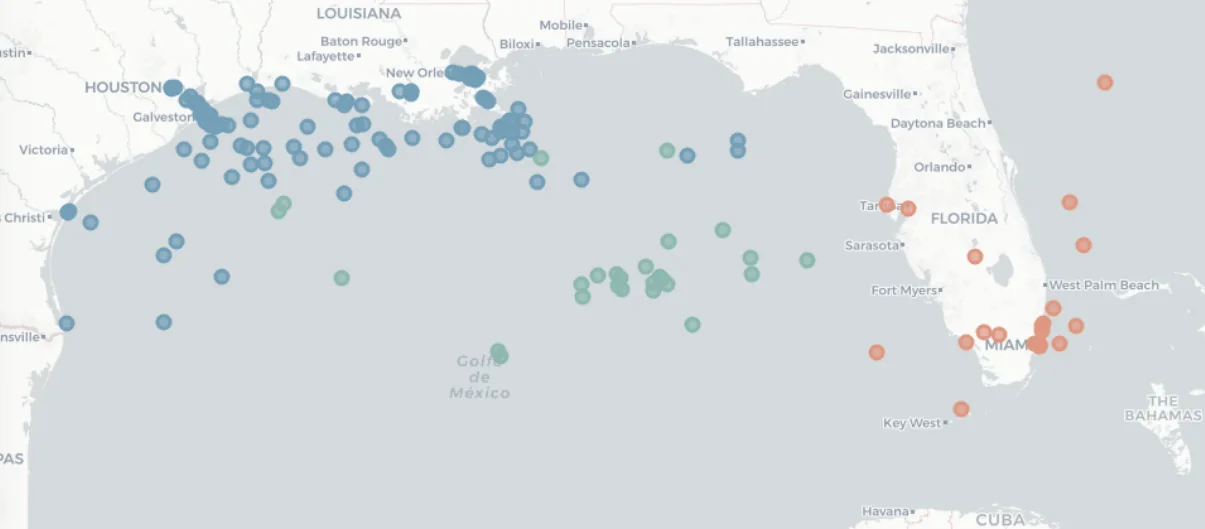
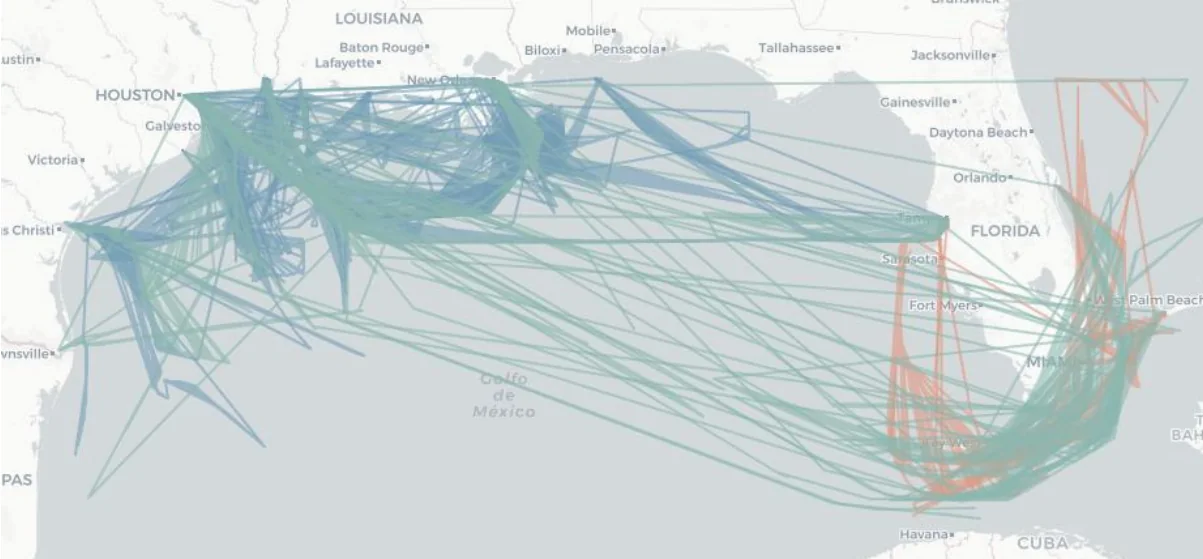
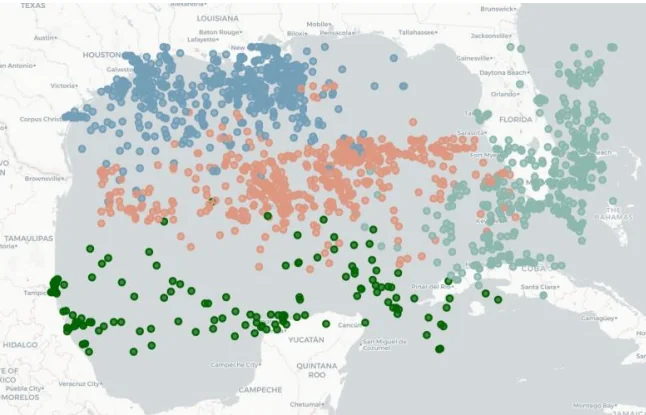
Extraction of 10 descriptors per trajectory: geographic bounds, centres, extents, area covered, total distance. After normalisation and selection of the relevant parameters, K-means on these new features reveals distinct activity areas, consistent both spatially and by vessel type.
-
Predicting the vessel type
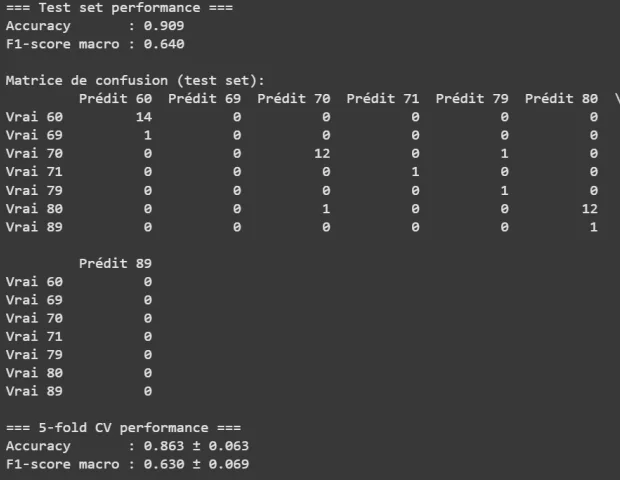
A classification model predicts the vessel type; it is evaluated with a confusion matrix and cross-validation. An extra feature, the vessel's estimated capacity computed with a naval architecture formula, is justified by the correlation matrix and the boxplots.
-
Predicting trajectories
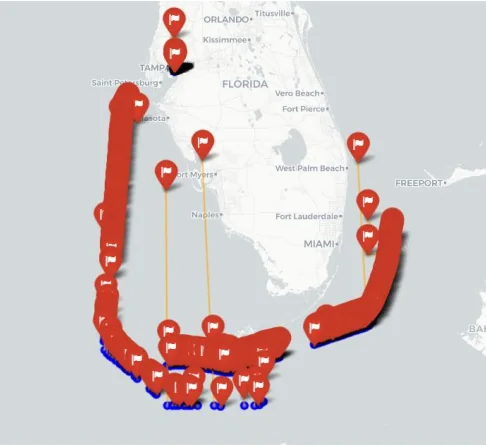
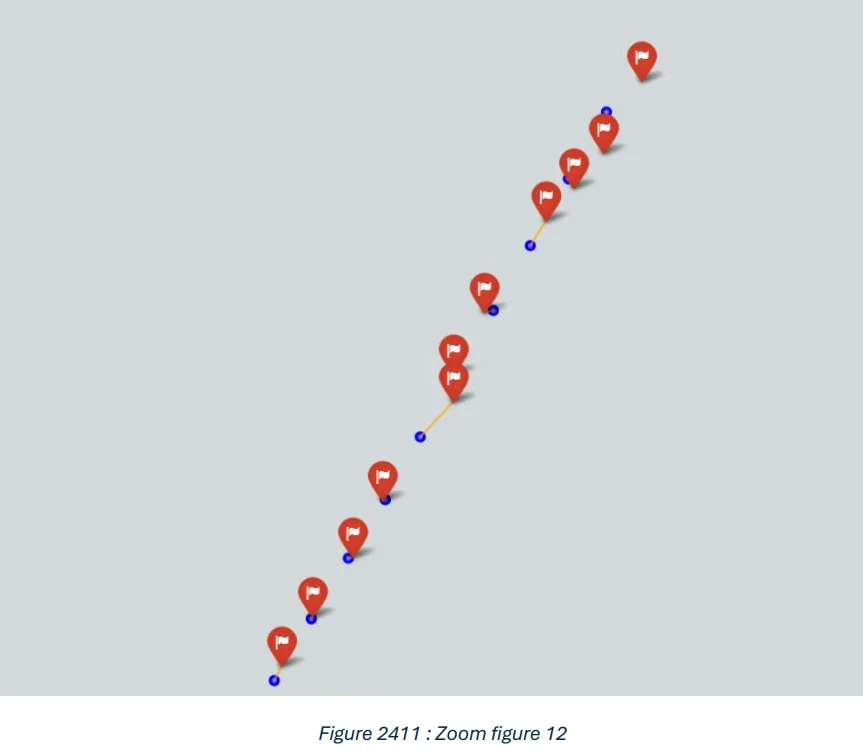
A MultiOutputRegressor predicts latitude and longitude 5, 10 and 15 minutes ahead. The predicted positions (red flags) follow the actual positions (blue dots) very closely.
-
Validation on the real AIS database
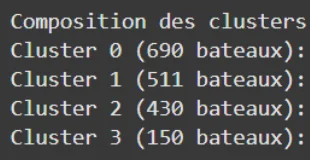
The whole approach was then run again on the actual maritime traffic data. Only the new clustering is shown here.
Web development
-
Application architecture
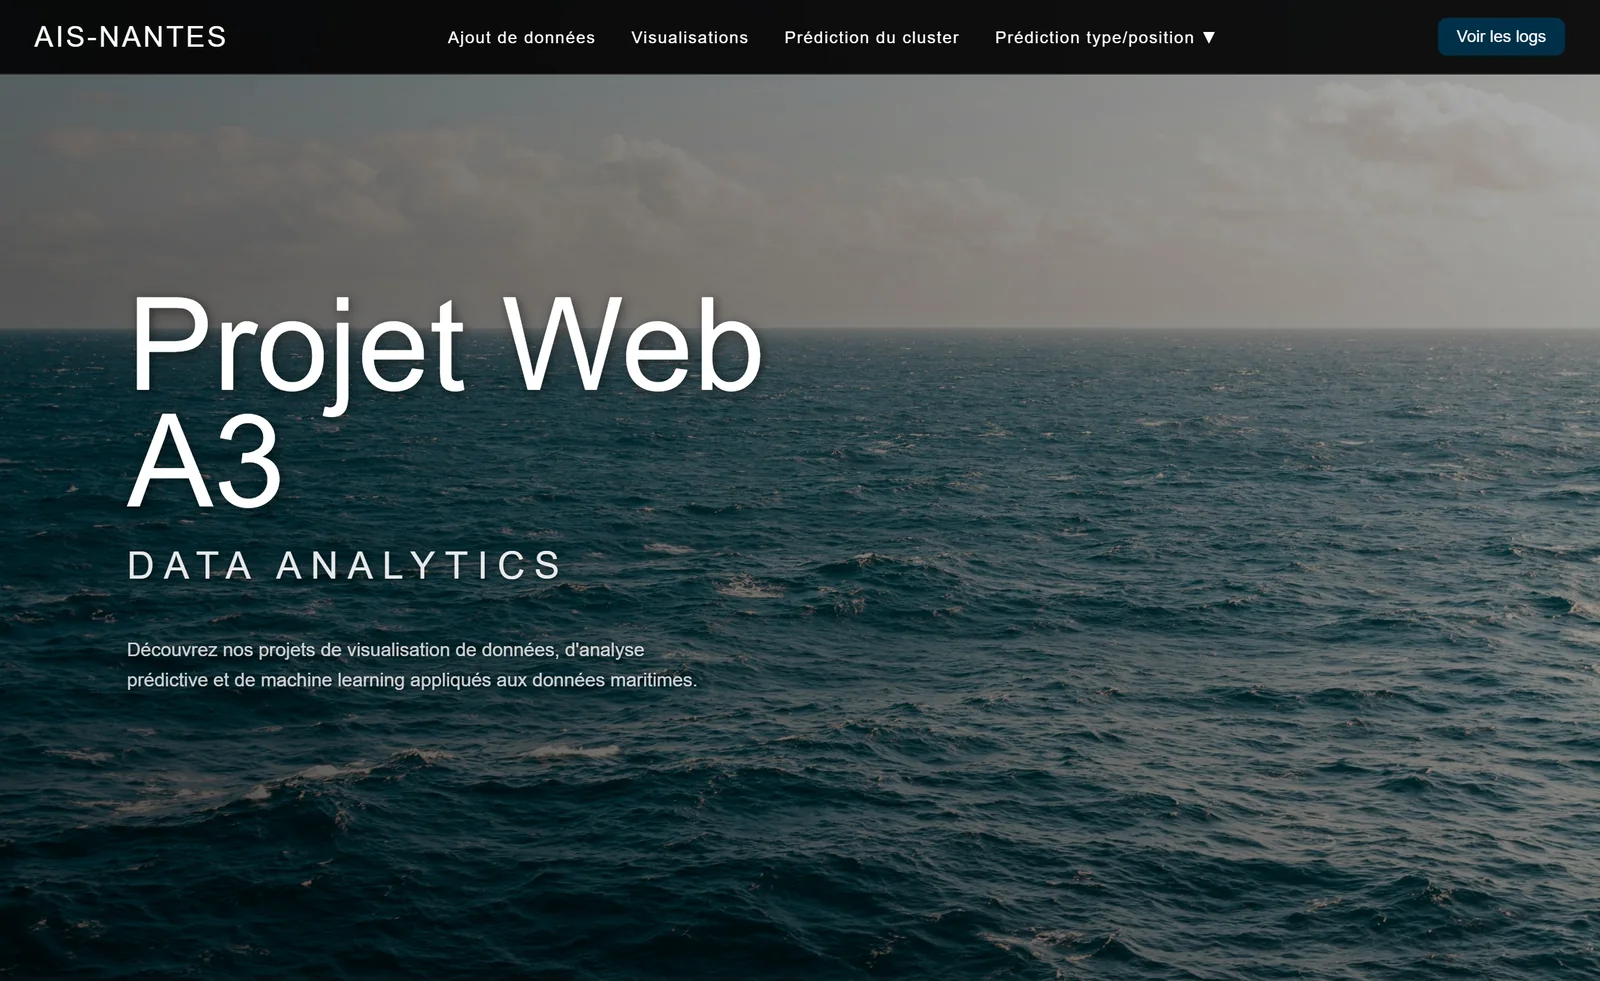
A complete web application (HTML, CSS, JavaScript, PHP, Python scripts, SQL) to explore the results of the analysis interactively.
-
Vessel viewer
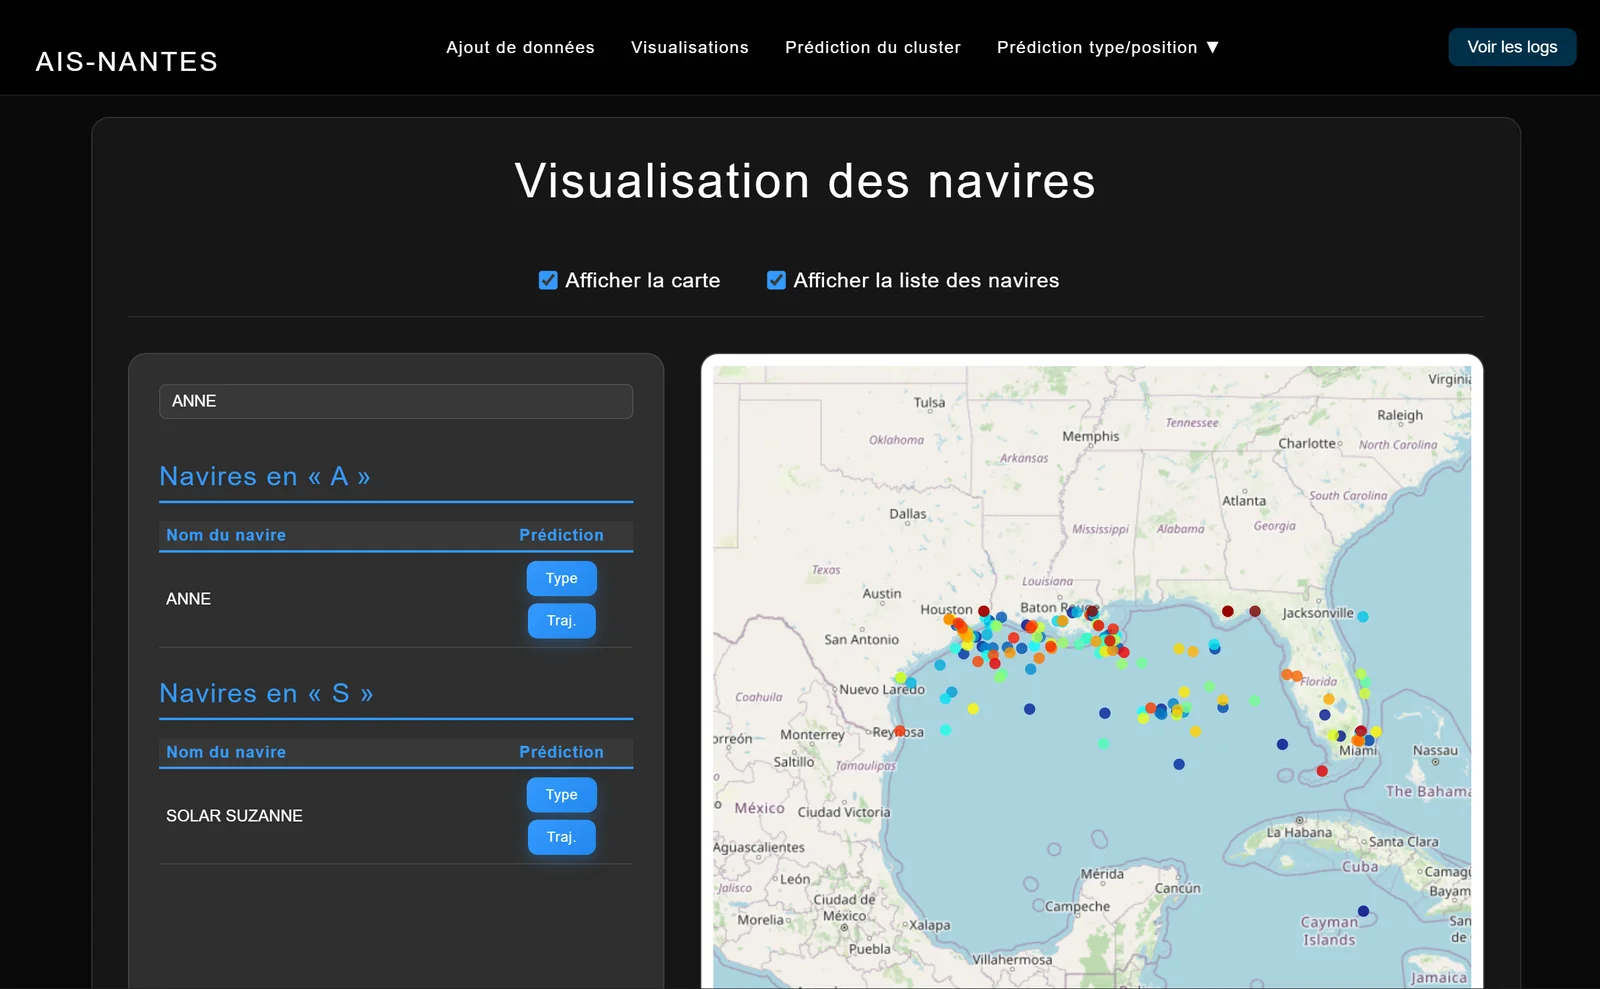
Vessel search and display with a dual view, detailed list and interactive map. Buttons trigger the type and trajectory predictions for the selected vessel.
-
Add-a-vessel form
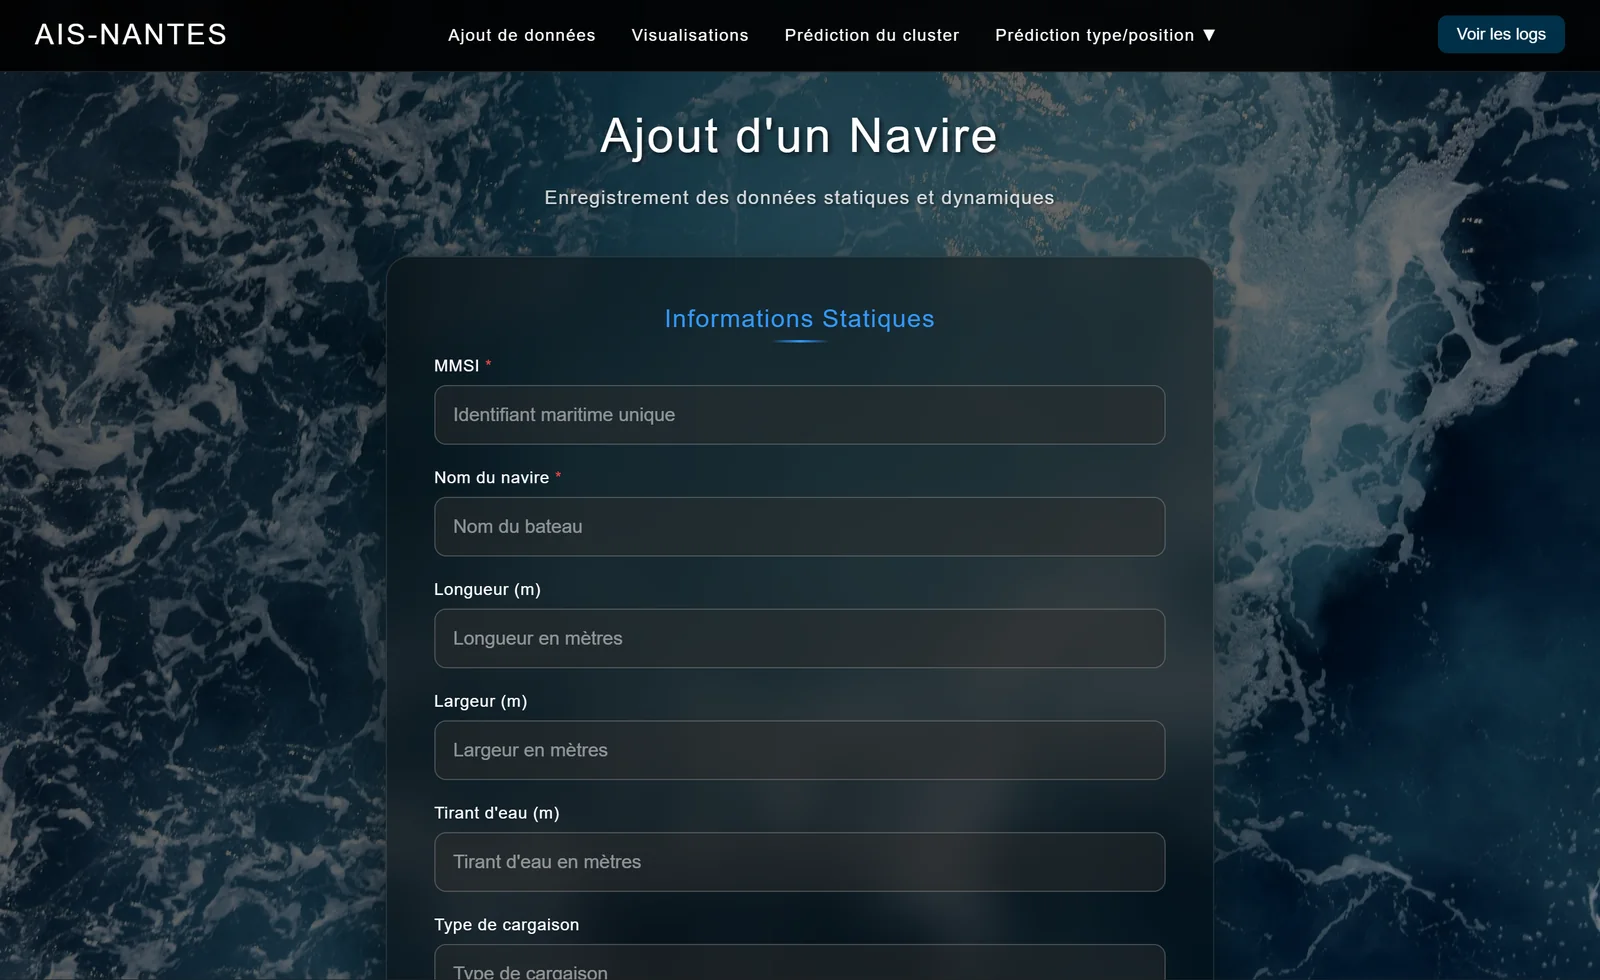
A detailed form to register new vessels, with their static information (MMSI, name, dimensions) and dynamic information (position, speed, course). Data is validated in real time and stored in an SQL database.
-
Interactive geospatial clustering
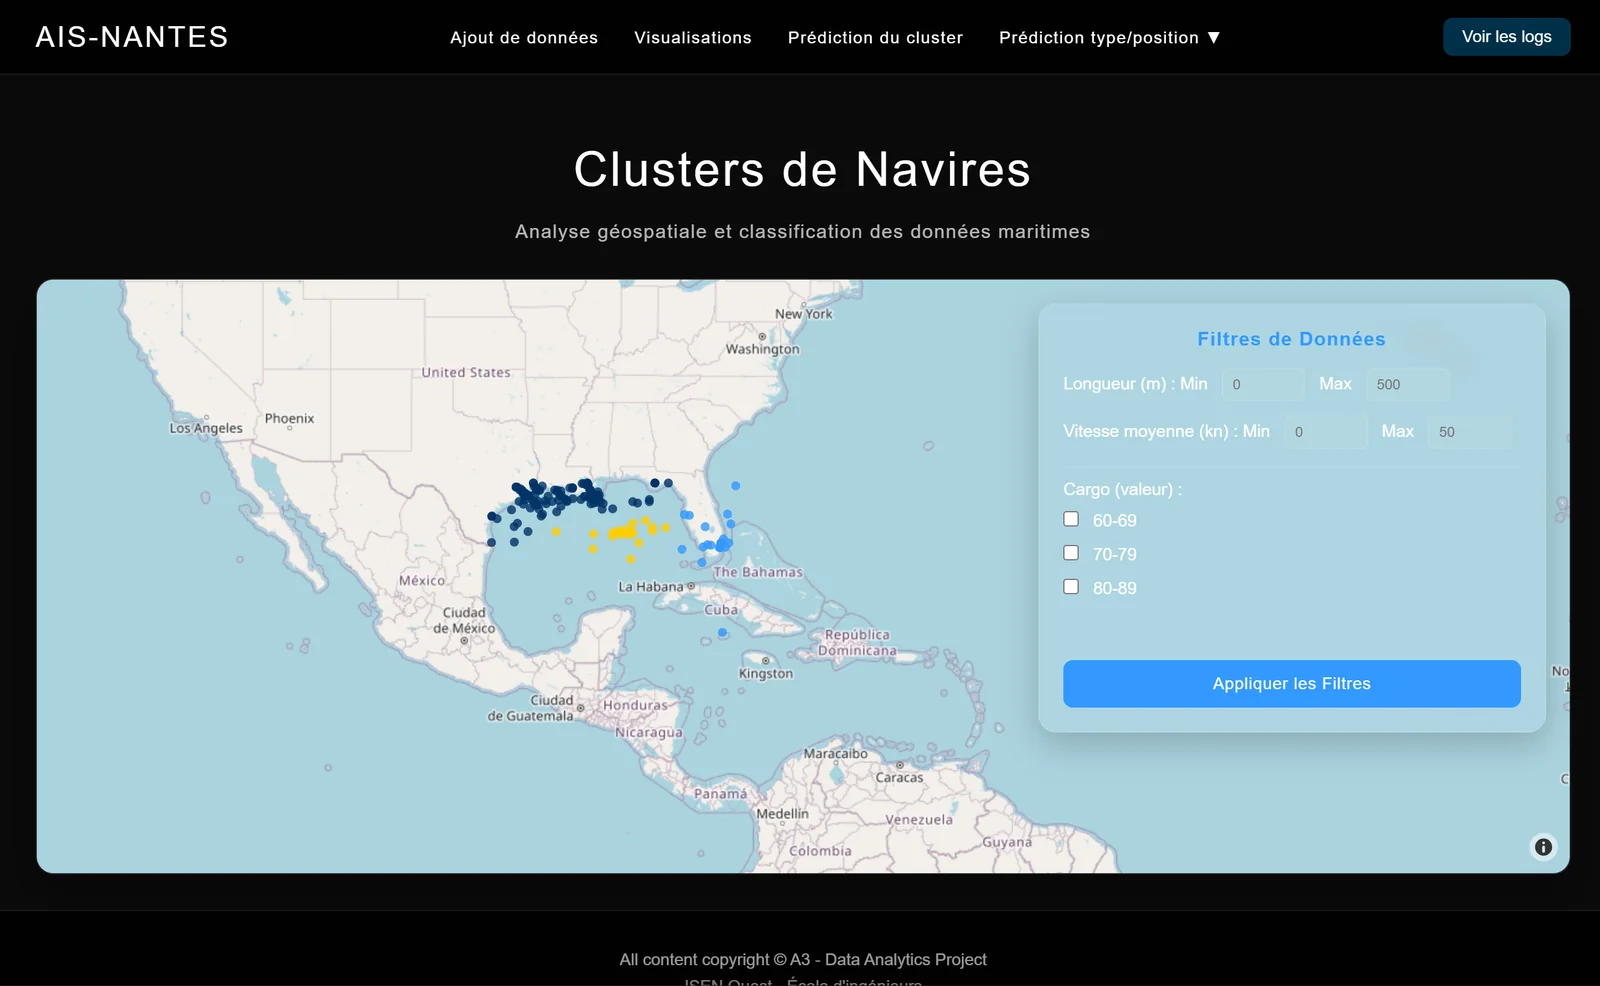
Computation and display of vessel clusters on an interactive map, with dynamic filters (length, average speed, cargo type) to spot activity areas and navigation patterns.
-
Vessel type prediction
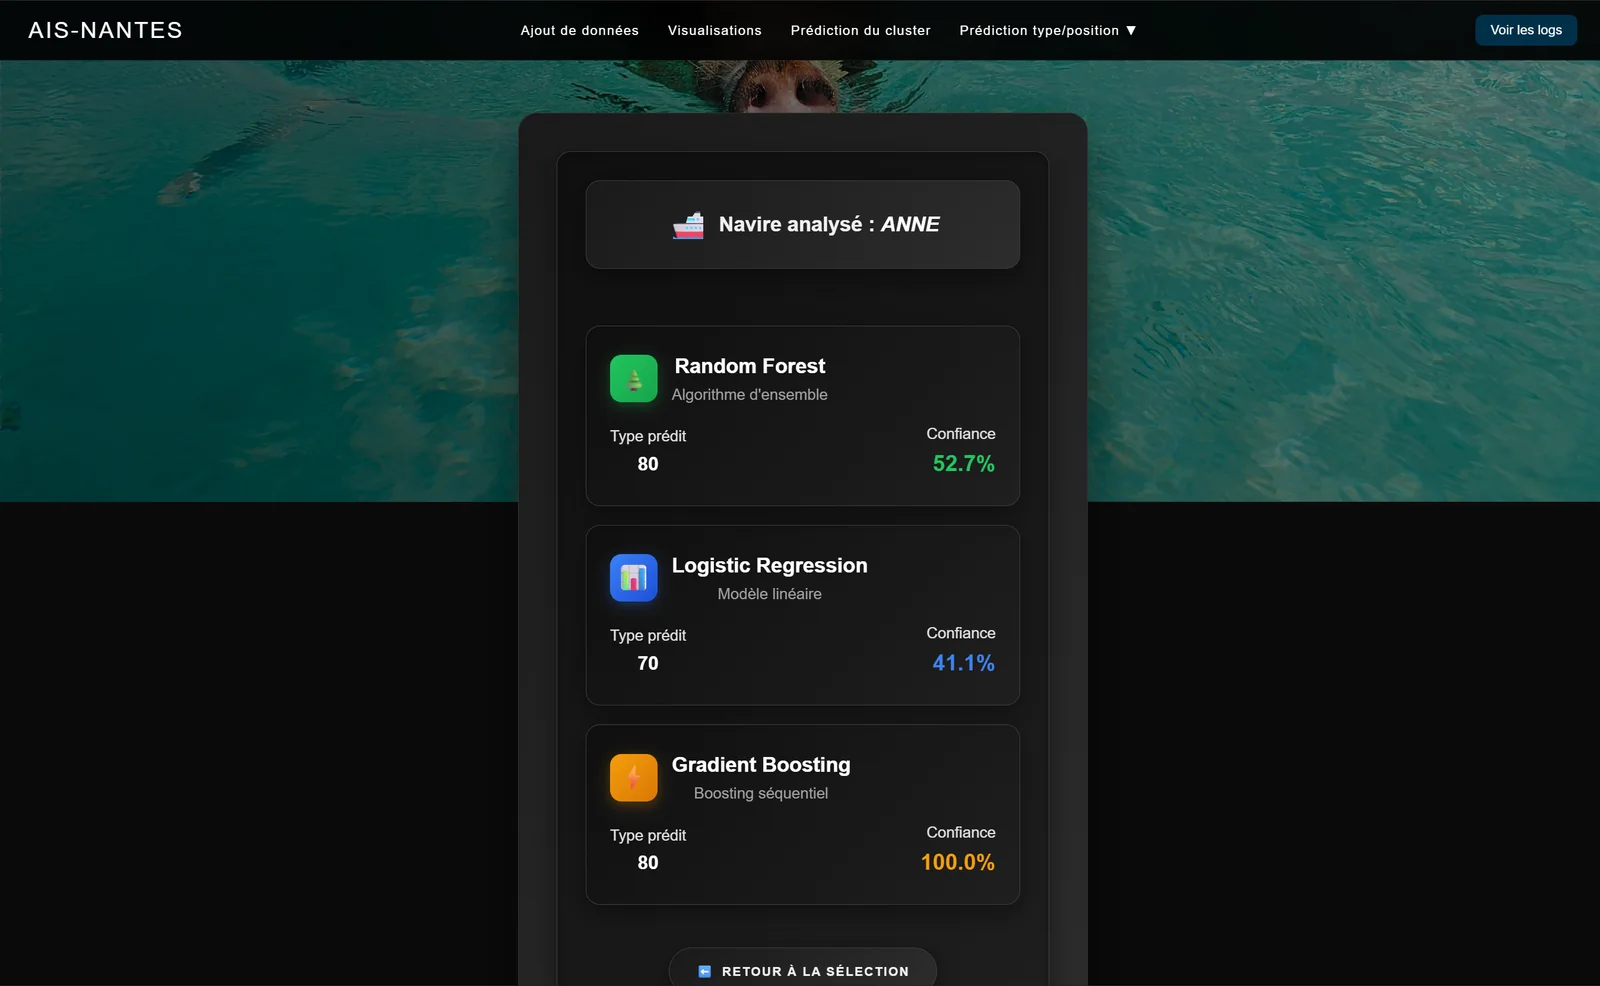
Three models (Random Forest, logistic regression, Gradient Boosting) classify the vessel automatically; each model's confidence score is displayed for comparison.
-
Trajectory prediction
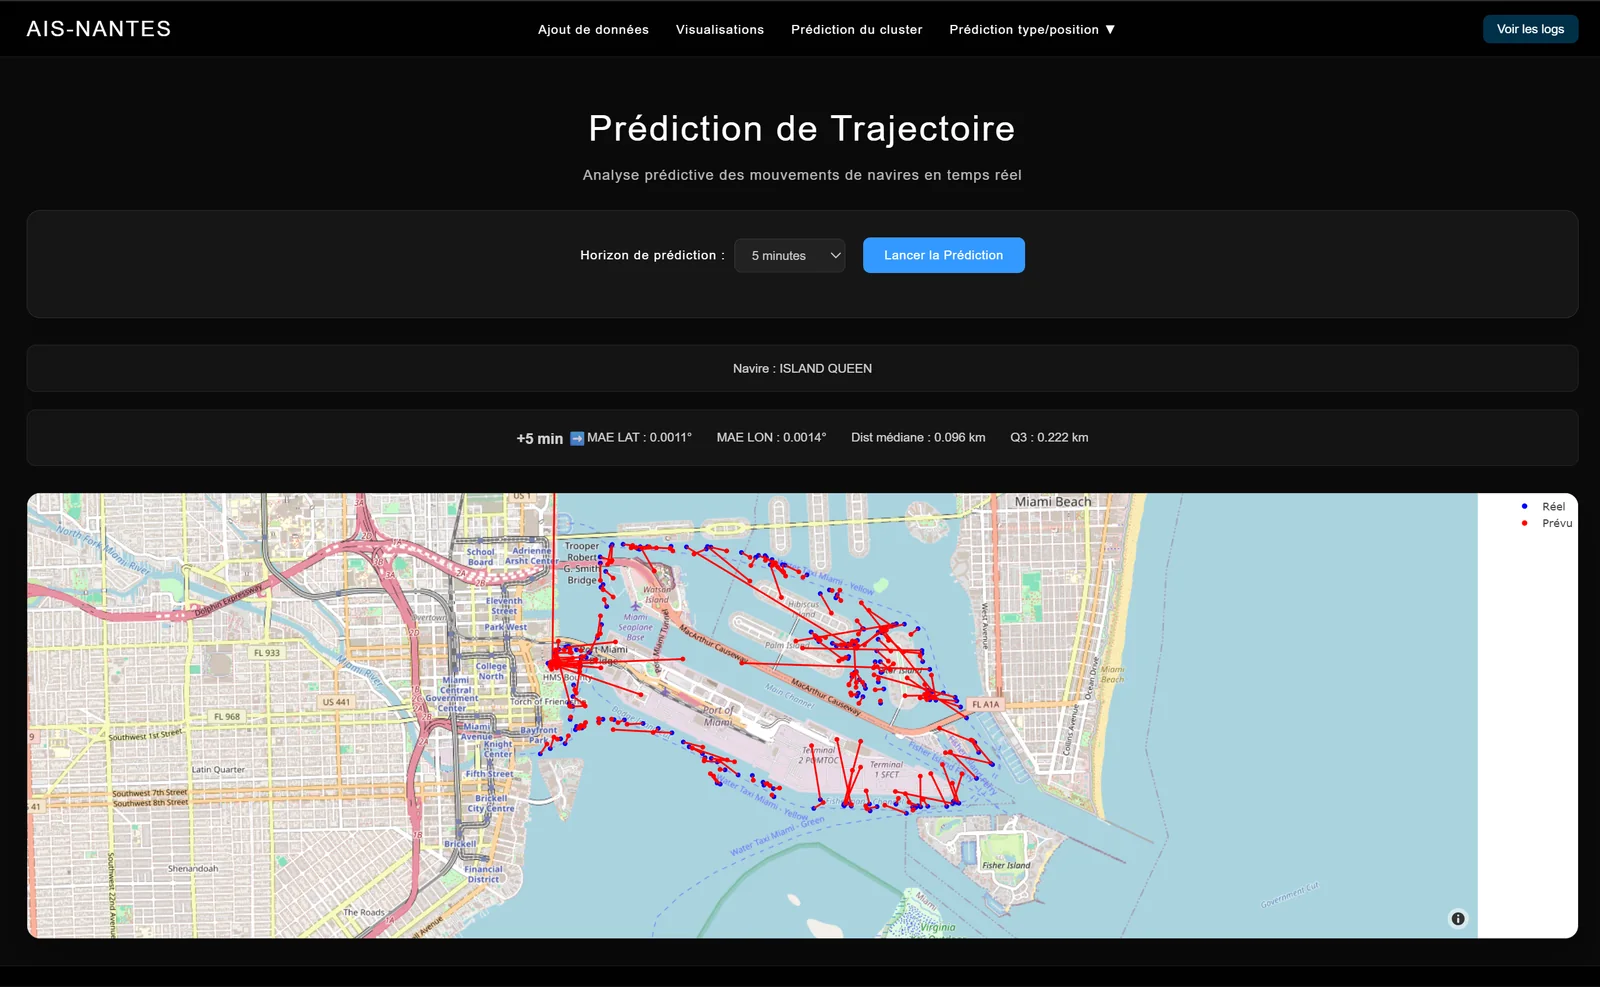
Prediction of a vessel's trajectory with a choice of horizon (5, 10 or 15 minutes). On the map, blue dots are actual positions and red dots are predicted ones.
-
Client-server interface
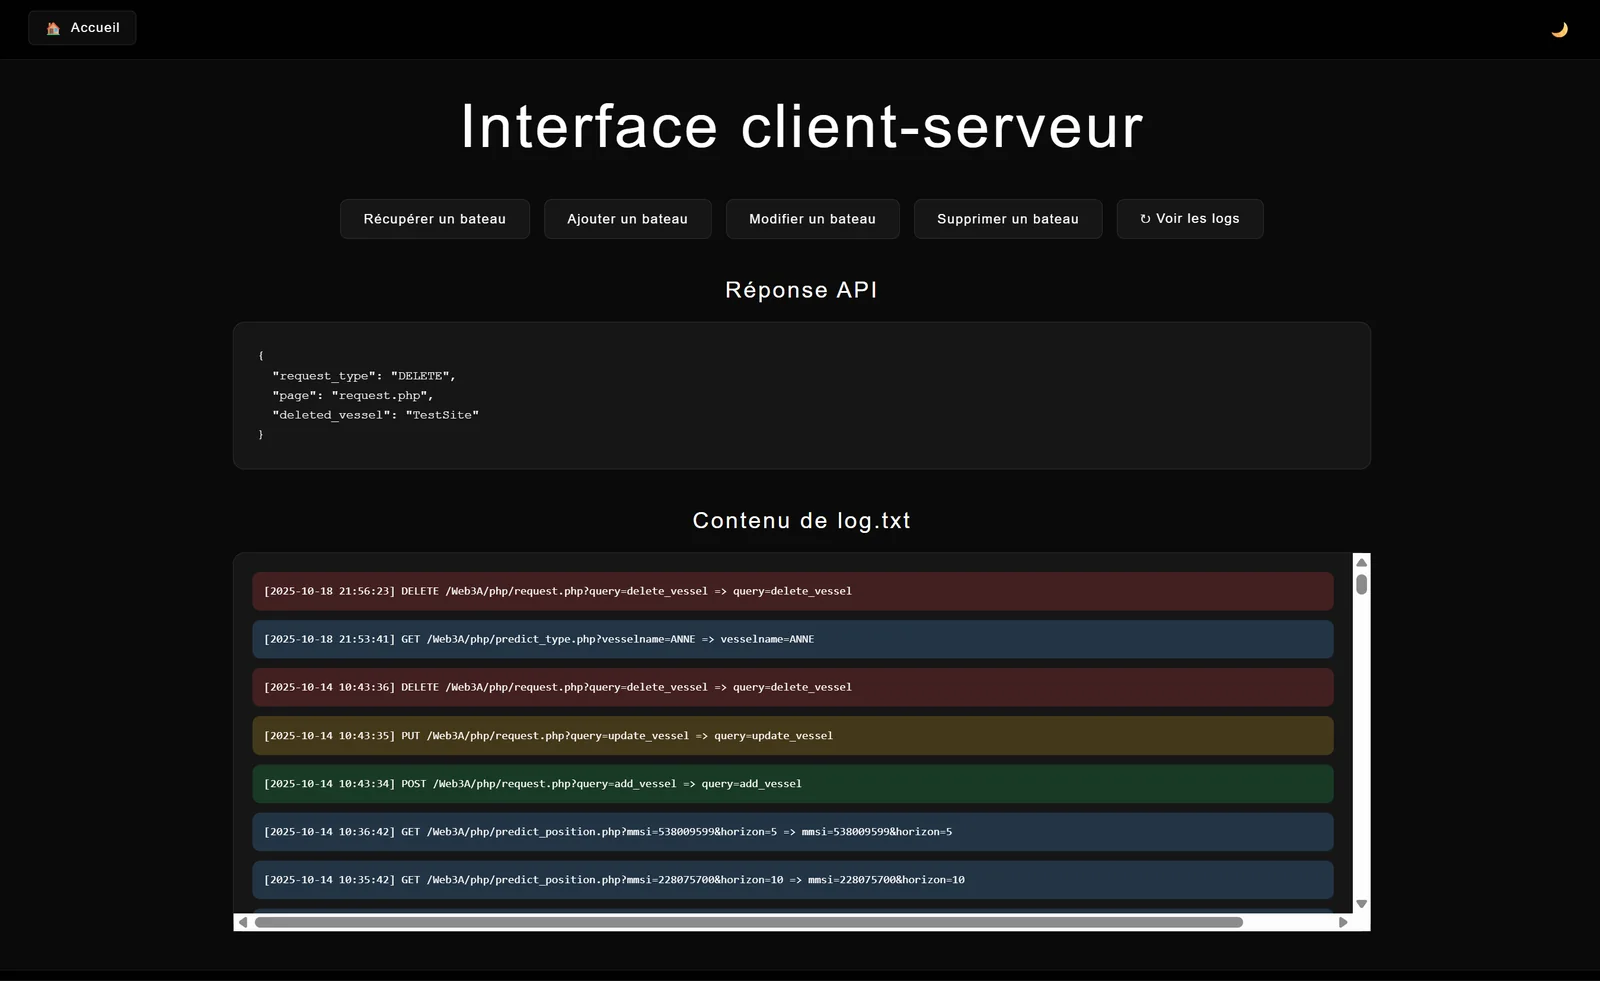
Buttons test the CRUD requests (create, read, update, delete) of the REST API, and a log shows every operation performed on the database in real time.
Documents
The full project reports and presentation slides.