Detect
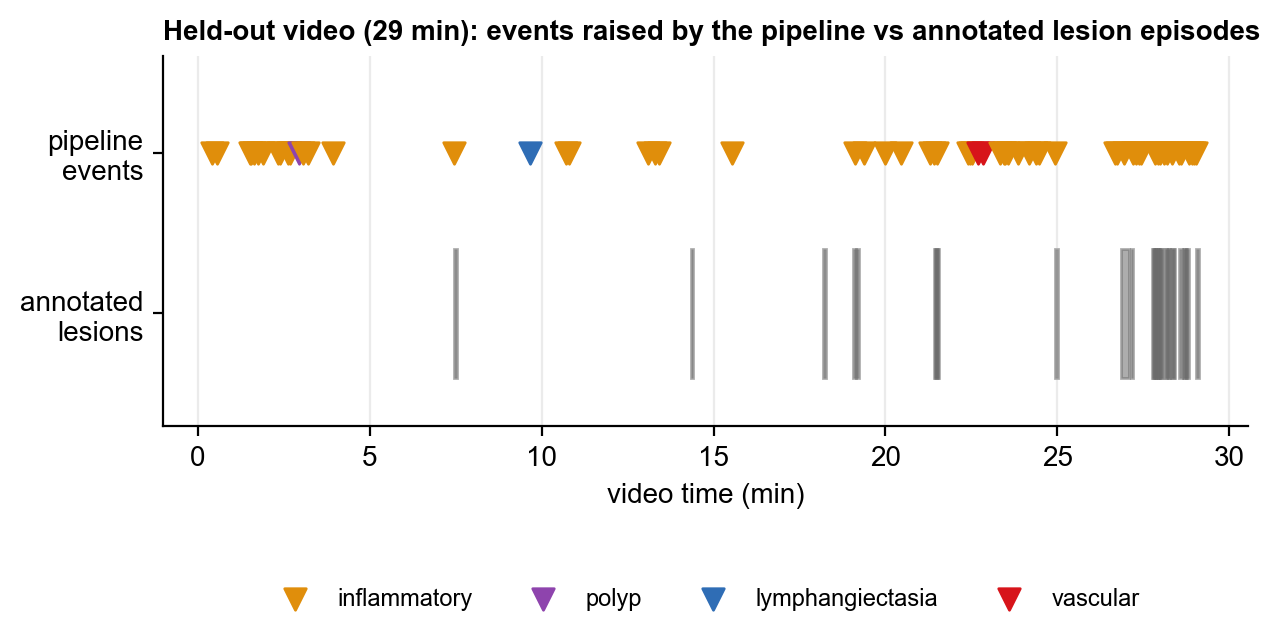
56 of 79 lesion episodes found (71%) at 1.2 false alerts per minute, against 66% for the initial rule at equal burden. At the wider setting: 67 of 79 (85%).
Research internship · 4 months
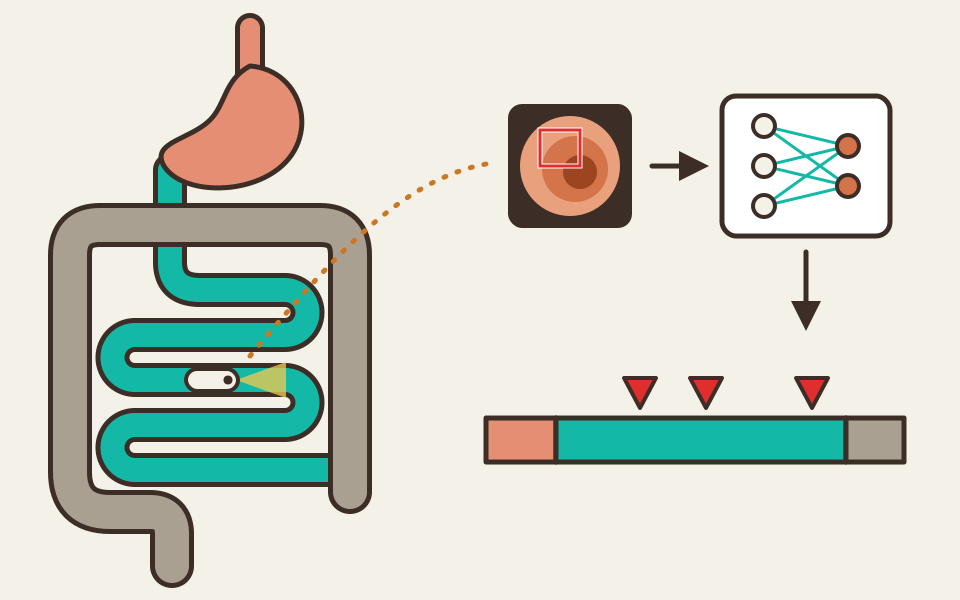
End-of-M1 internship at the Institute of Systems and Robotics of the University of Coimbra, Portugal. I designed a pipeline that goes through a capsule endoscopy video and reports each suspected lesion with its timecode, an annotated screenshot, its clinical category and its position in the digestive tract.
All measured on videos of patients the models have never seen.
Capsule endoscopy is the reference examination of the small bowel. The patient swallows a capsule the size of a large pill, which films the digestive tract for eight to twelve hours. The physician then reviews 50,000 to 100,000 frames: between thirty minutes and two hours of reading, during which a lesion visible on only a few frames can go unnoticed.
A pipeline that takes a complete video and outputs, for each suspected anomaly: its timecode, an annotated screenshot, its clinical category and its location — stomach, small bowel or colon, then position within the small bowel as a percentage of transit time. Knowing where a lesion lies matters as much as knowing what it is: the choice of intervention depends on it.
The internship took place at the Institute of Systems and Robotics (ISR) of the University of Coimbra, in the group of Professor Hélder Araújo, which works on computer vision and its medical applications. It was an individual research and development project, carried out in English in a highly international laboratory.
The initial subject aimed at the capsule trajectory in centimetres. No public data can verify it: a single camera gives no scale, and the capsule advances, stops and moves backwards with peristalsis. I therefore proposed an anatomical localisation, which keeps the clinical purpose while remaining measurable.
Only public, anonymised datasets (Kvasir-Capsule, Capsule Vision 2024, WCEbleedGen), a laptop without a graphics card for video processing, and Kaggle's free GPU quota for training.
From raw video to report, in six steps.
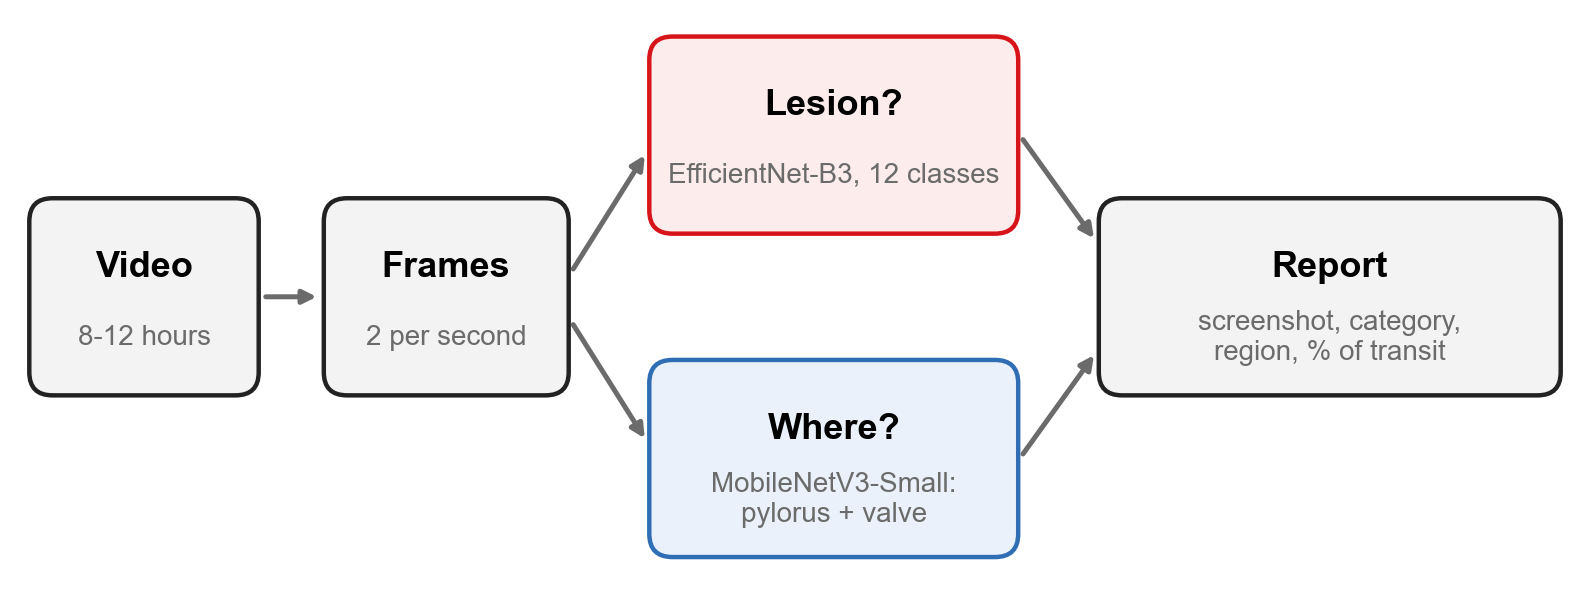
The video is read with OpenCV at 2 frames per second: a 40-minute recording yields about 4,800 frames to analyse.
An EfficientNet-B3 network fine-tuned on 12 classes: eight lesion types, normal mucosa, degraded views (bubbles, debris) and the two anatomical landmarks. The lesion probability of a frame is the sum of the eight lesion classes.
Flagged frames less than two seconds apart form an episode, whose clinical category is voted by its frames; contiguous episodes form a zone. The physician thus gets one place to check, not fifty frames.
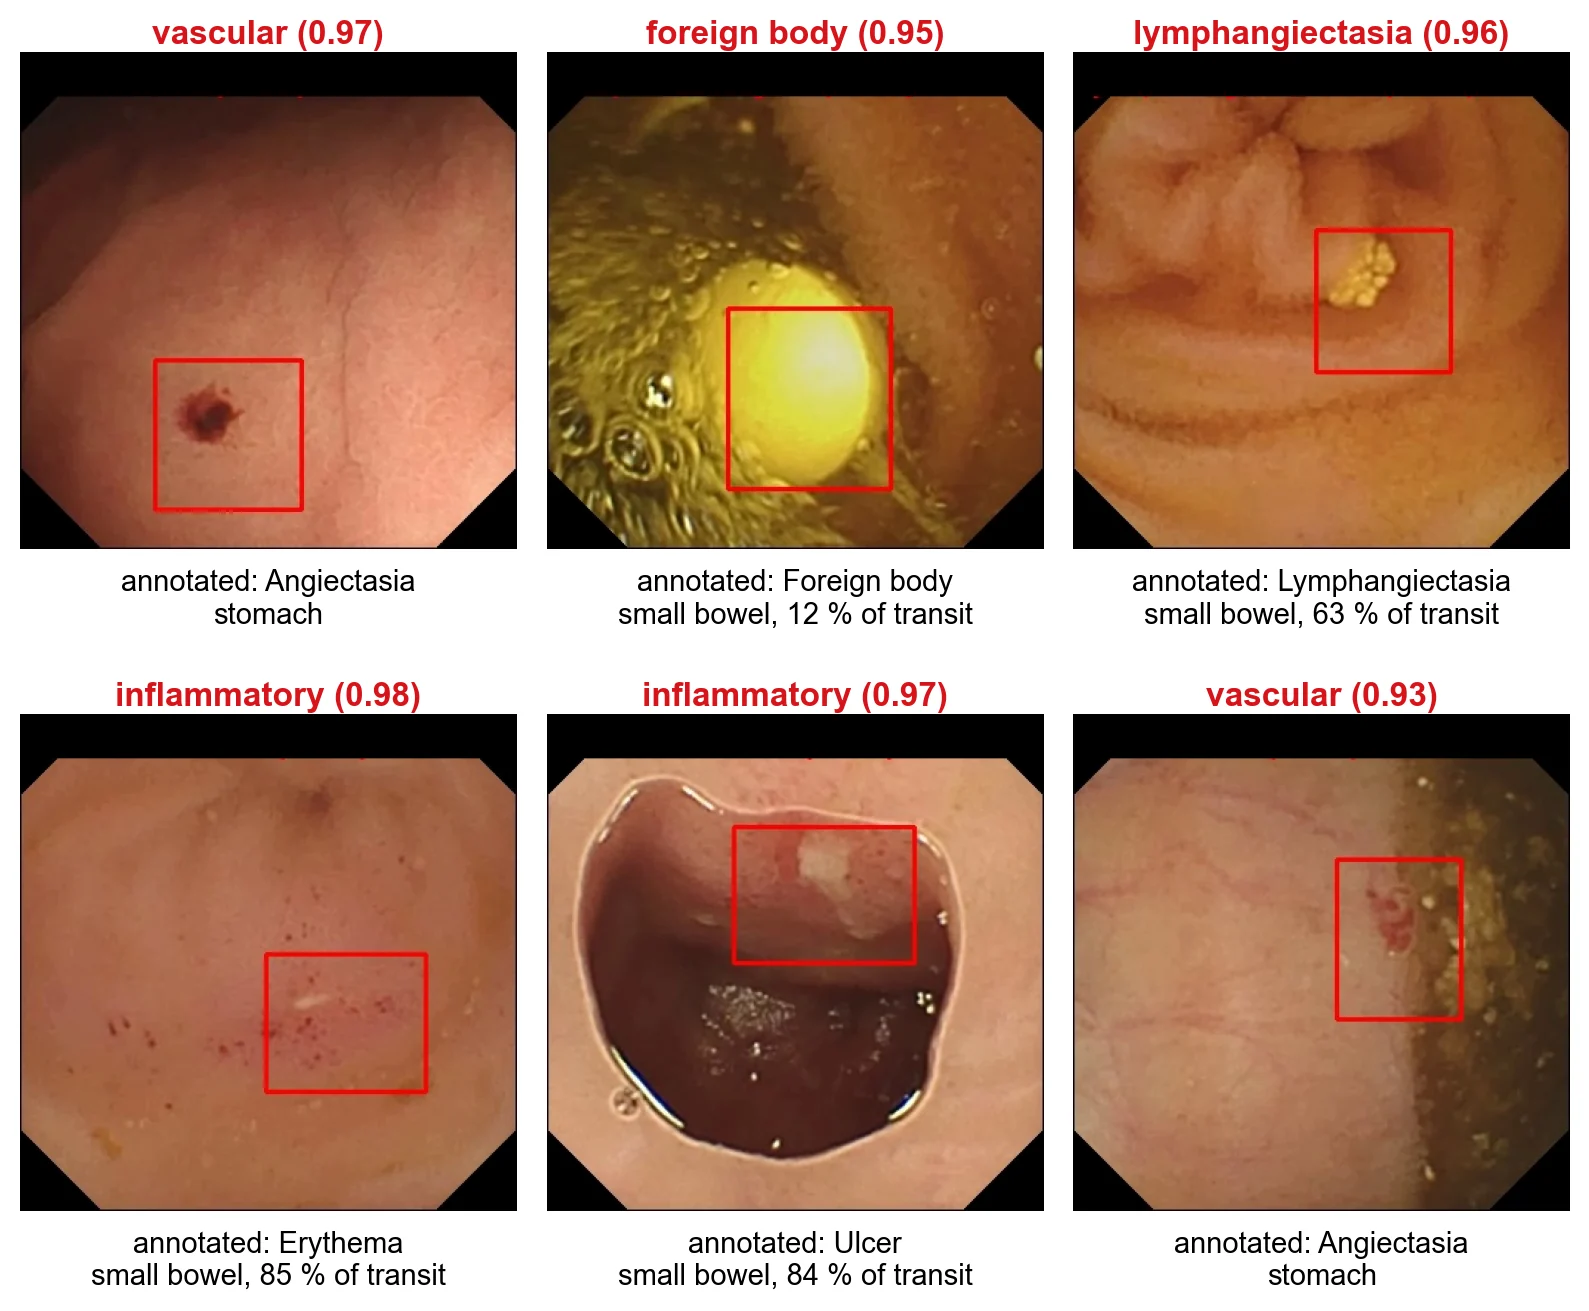
Grad-CAM locates the image region that triggered the alert; it is boxed on the screenshot attached to each event.
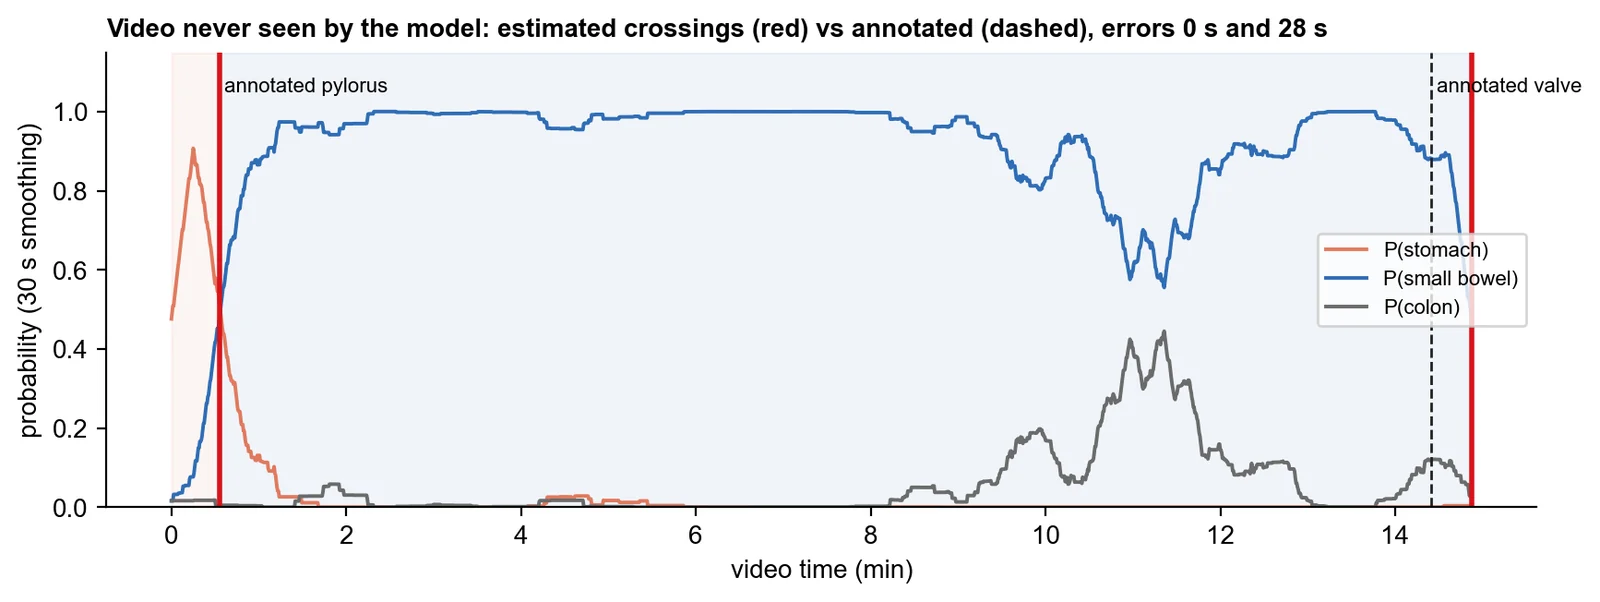
A second network, MobileNetV3-Small, recognises the pylorus and the ileocecal valve. These two crossings split the video into stomach, small bowel and colon; the position of a lesion within the small bowel is the time elapsed since the pylorus, divided by the total transit time.
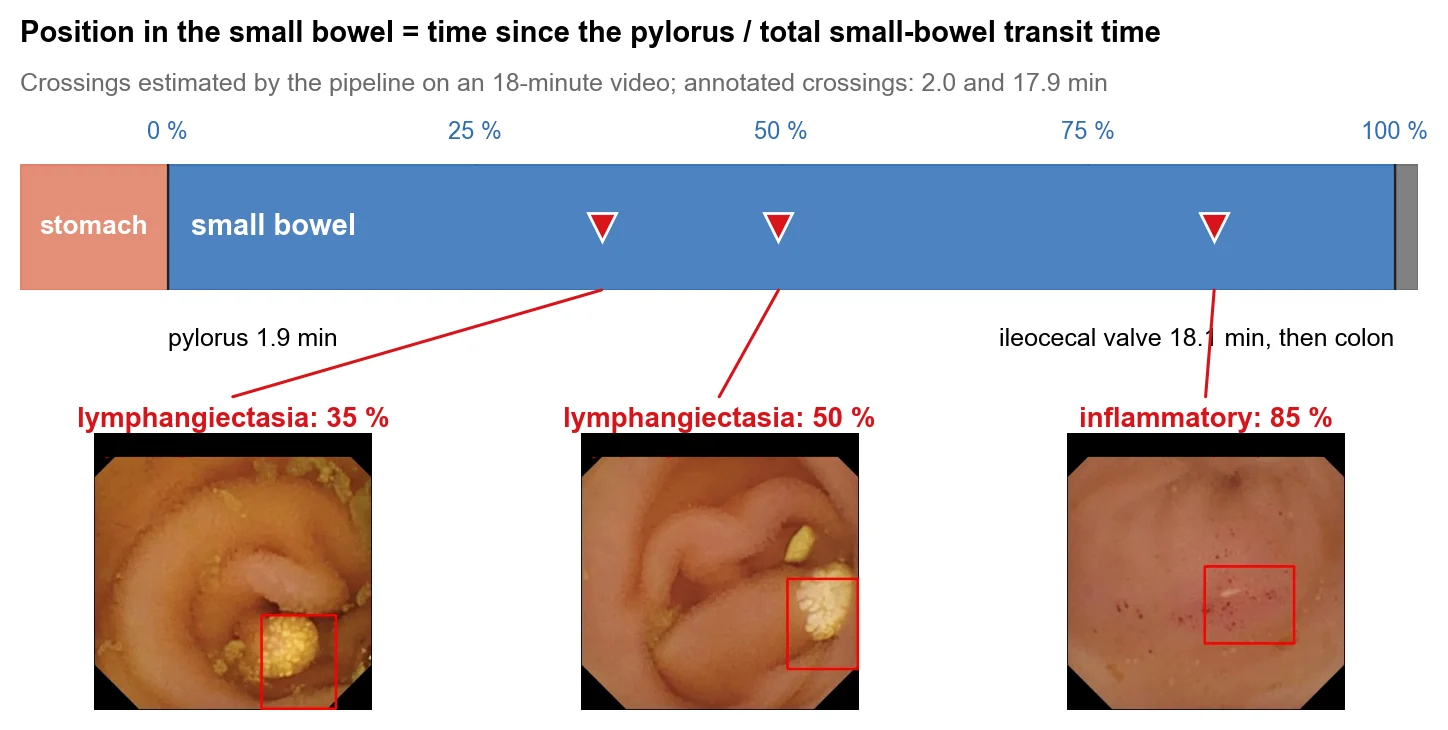
One JSON file per video lists the events with all their fields, together with a timeline. Every model decision is saved frame by frame, so any rule can be replayed without re-running hours of computation.
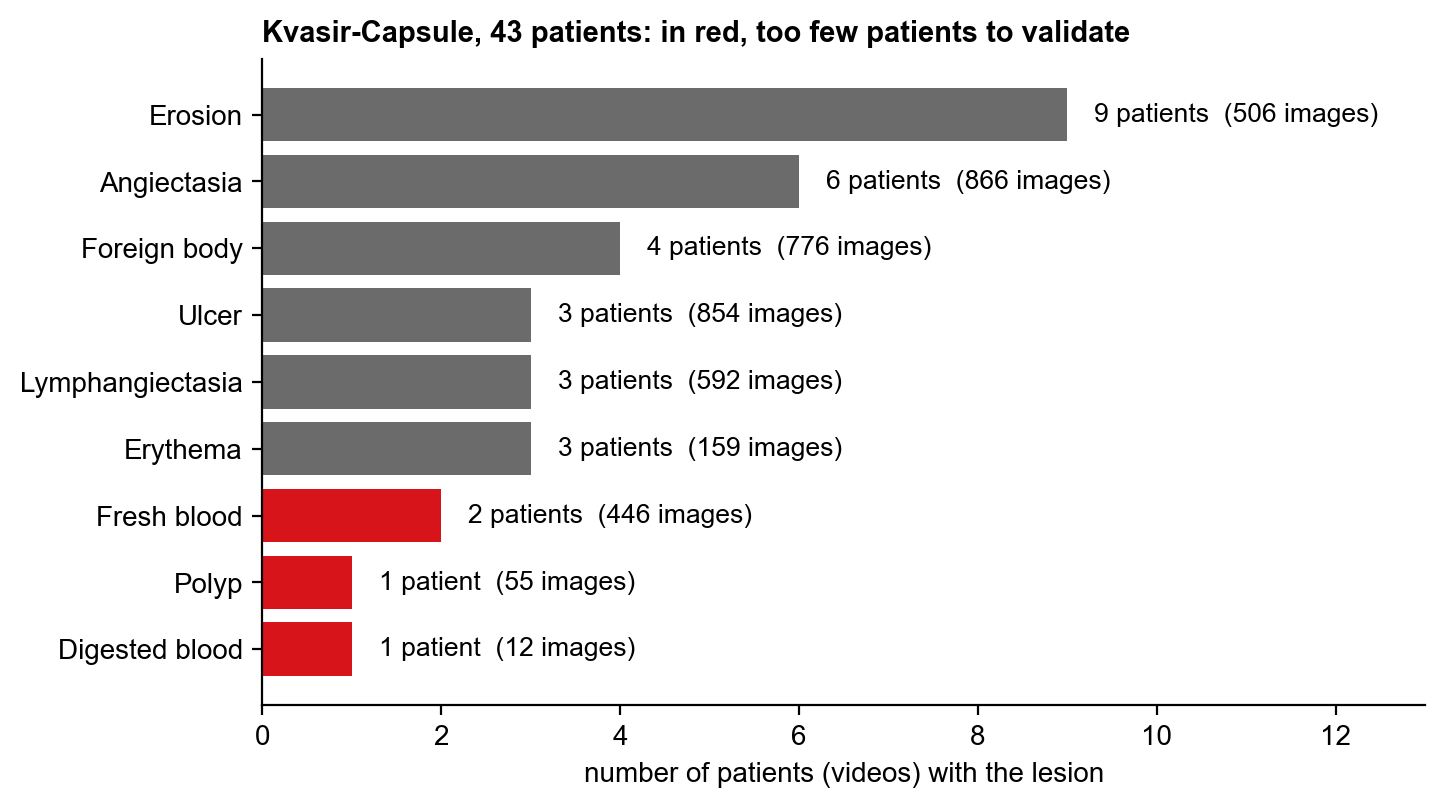
Building the pipeline was not the hardest part: the real challenge was proving how good it is. A model evaluated on images of a patient it saw during training looks far better than it is: studies reporting over 95% mix images of the same patient, whereas with a split by patient the best published results on this dataset peak at a macro-F1 of 0.35.

Measured once on the held-out videos, with a tolerance of ± 5 seconds.
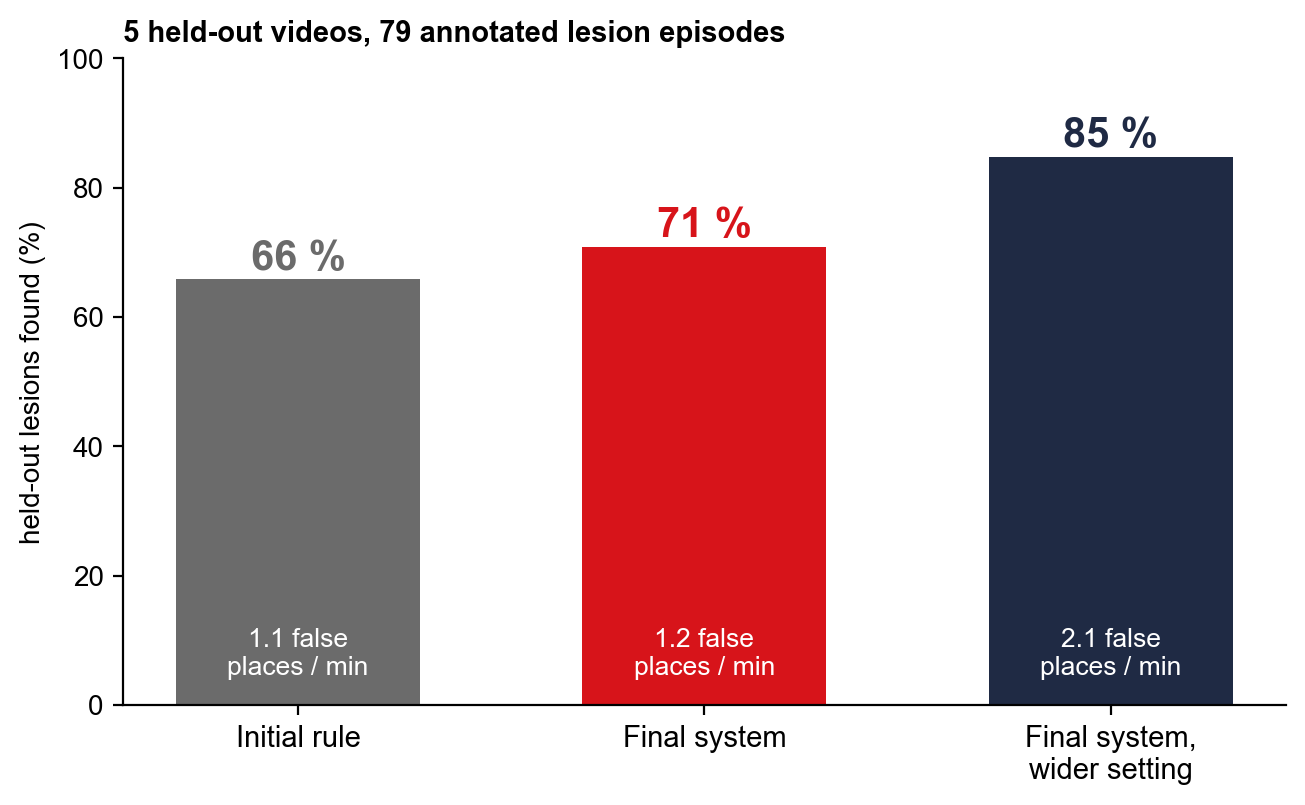
56 of 79 lesion episodes found (71%) at 1.2 false alerts per minute, against 66% for the initial rule at equal burden. At the wider setting: 67 of 79 (85%).
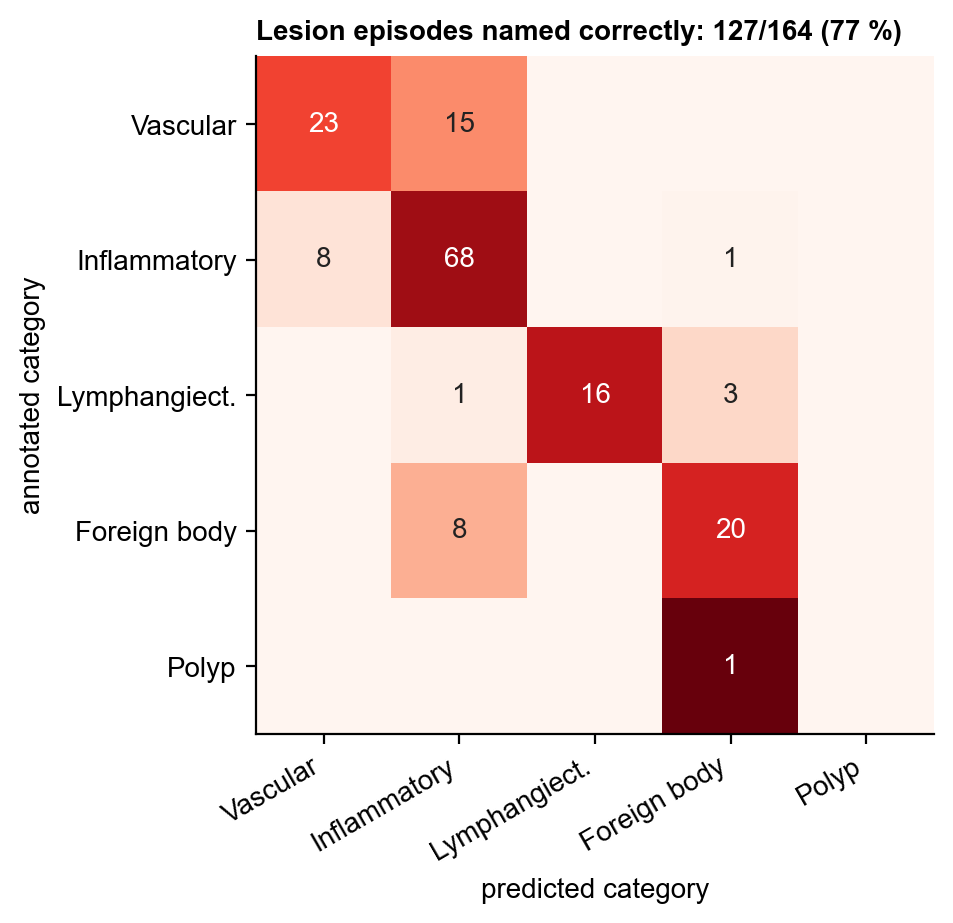
53 of the 56 lesions found receive the right clinical category out of five: vascular, inflammatory, lymphangiectasia, foreign body, polyp.
64 of 67 lesions placed in the correct region, with a median error of 0.8 points on the position within the small bowel. A segmentation enforcing the anatomical order, measured separately, brings the pylorus error from 13 down to 5 seconds.
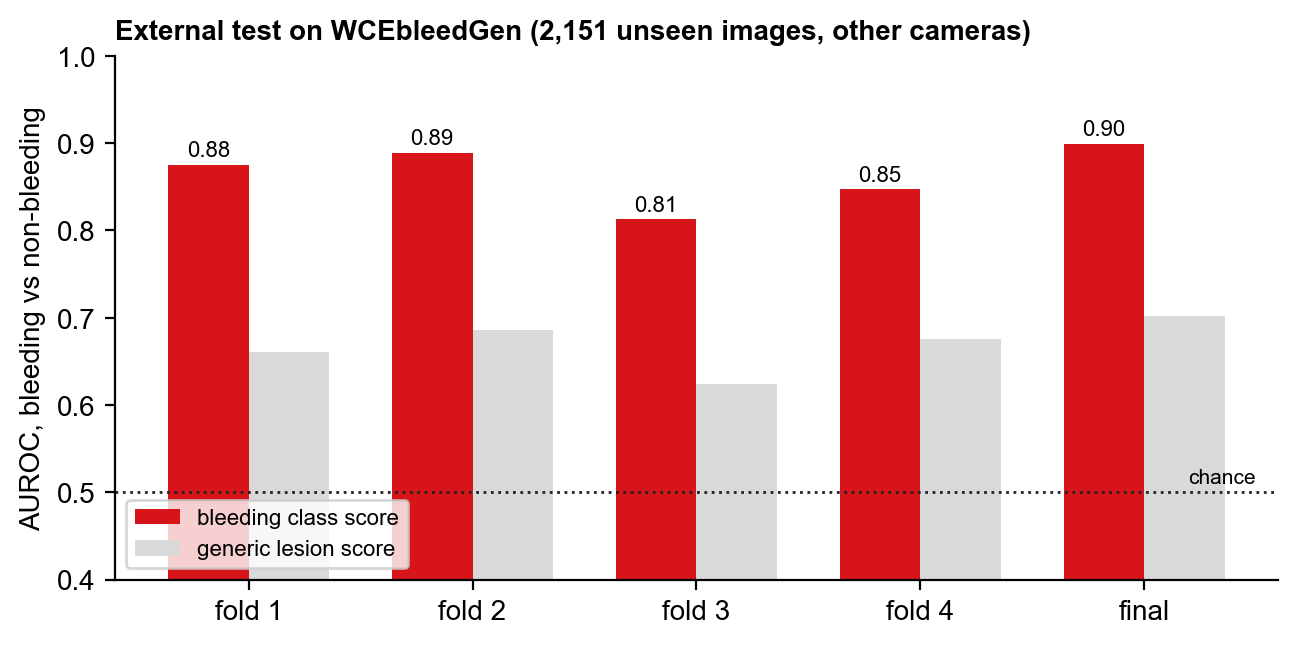
Almost all the fresh-blood images of the dataset come from a single patient: impossible to learn under cross-validation. Audited external images were added; on 2,151 never-seen images from another dataset, the AUROC reaches 0.90.
A medical tool is judged as much by its limits as by its results. These are stated plainly in the report.
Integrate the anatomical-order segmentation into the pipeline, validate on the 22 examinations of the Galar dataset filmed with the same camera in another hospital, and have a few videos fully annotated by a physician.
41 Python modules (about 6,200 lines), 10 training notebooks and over 60 commits.
EfficientNet-B3 and MobileNetV3-Small networks, training, inference, ImageNet pre-trained weights.
PyTorch 2.9
Video decoding and sampling, drawing of annotated screenshots, homography trials.
OpenCV 4.13
Activation map locating the image region behind the decision.
Section classifier, distance to normal mucosa (k-NN), AUROC and other metrics.
scikit-learn 1.6
Caches of model outputs, replay of decision rules, result tables.
Training on the free quota: about 3 GPU hours for the final models, 13 minutes per model.
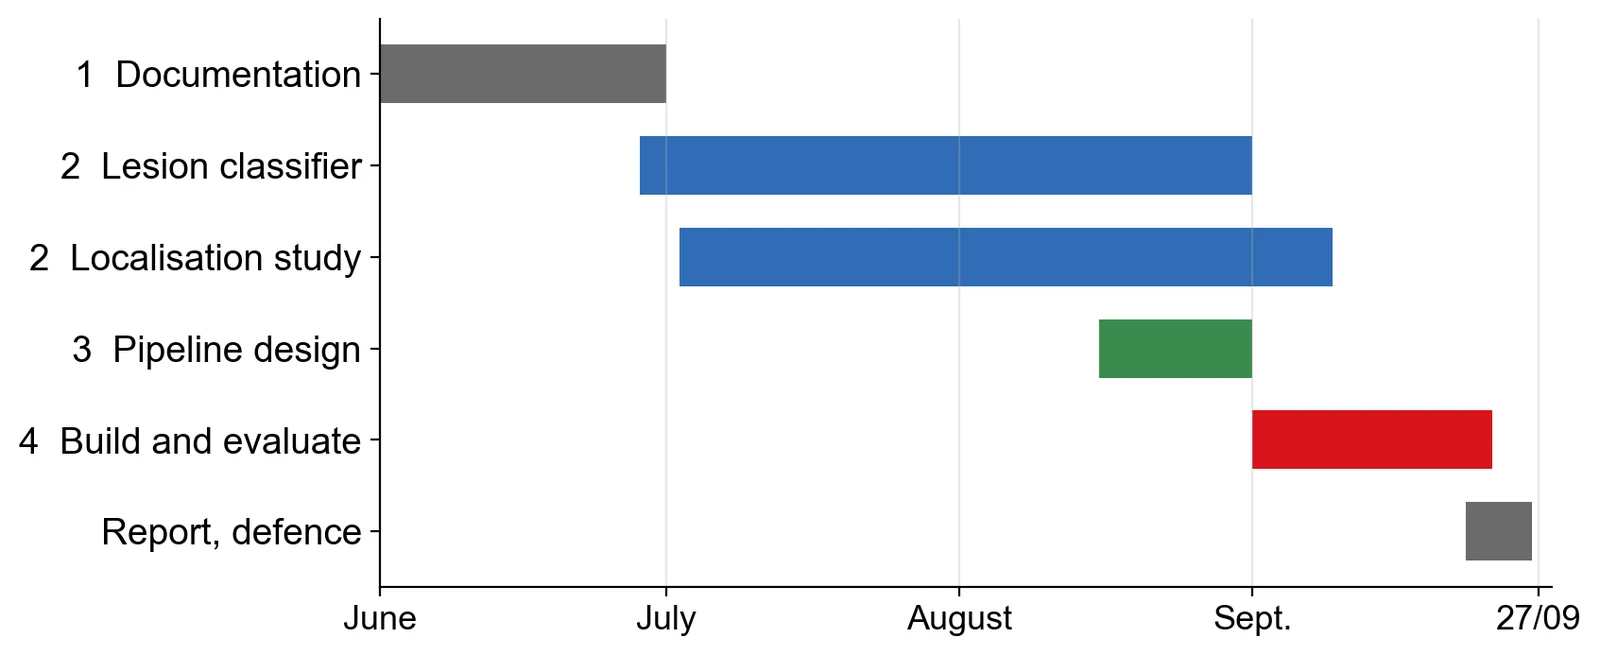
The project moved in short iterations, each ending with a measurement. Several attractive ideas were dropped because they failed their criterion: this is what makes the final figures credible.
The detail of every measurement, of the rejected options and of the evaluation protocol.
Endoscopic images: public Kvasir-Capsule dataset (CC BY 4.0 licence).